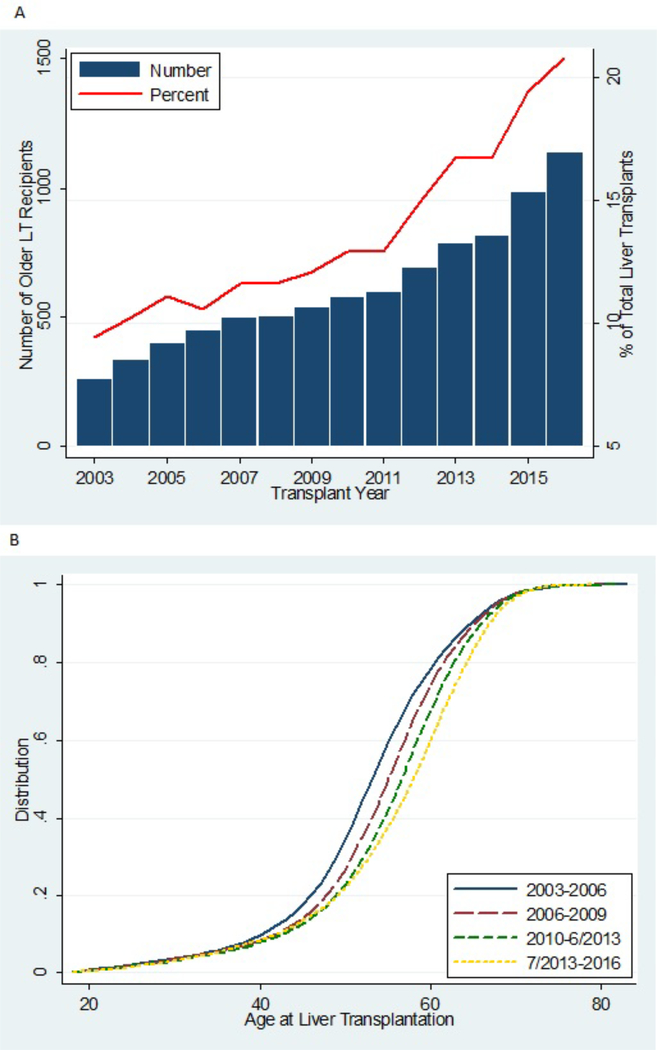
Figure 1.
Trends in 8,627 older liver transplant (LT) recipients according to year of transplant. (A) The number of older LT recipients is shown as a bar (left y-axis), and the percentage of total older LT recipients among 58,598 adult LT recipients is shown as a line (right y-axis). (B) For all older LT recipients from 2003–2016, the nested cumulative distribution of age at the time of LT is displayed according to year of transplant.

