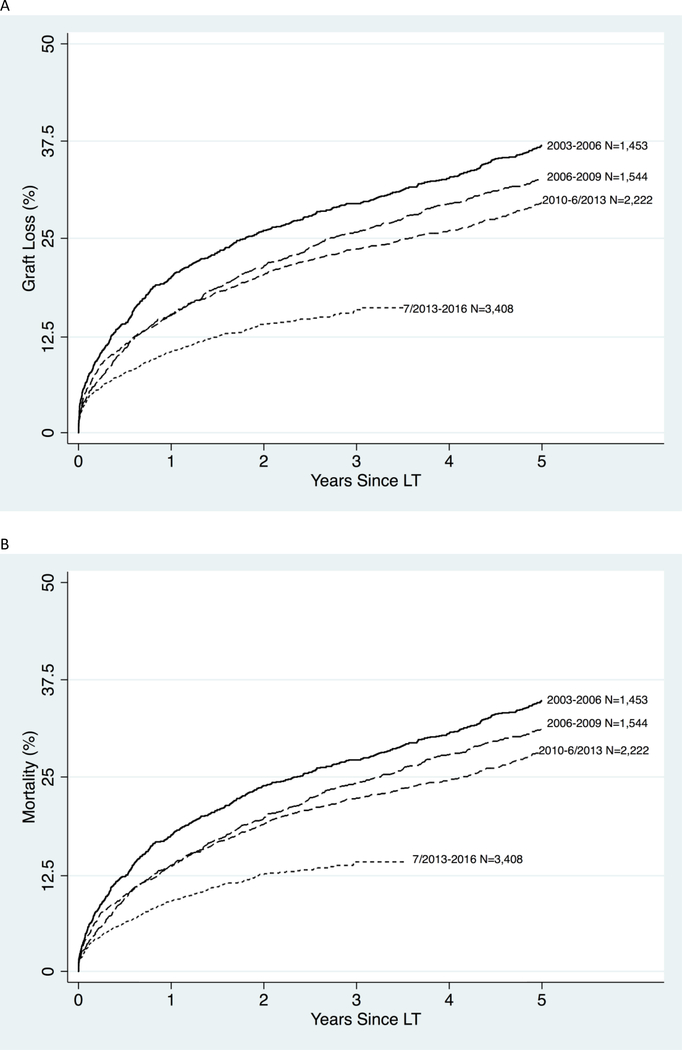
Figure 2.
Cumulative incidence of (A) all-cause graft loss and (B) mortality in older LT recipients by year. The year and number of LT recipients is seen to the right of the curve. The most recent time periods were split at 6/18/2013 after the allocation policy implementation of Share35. This policy increases regional liver allograft offers to patients with MELD score ≥35 to direct allografts to sicker candidates.

