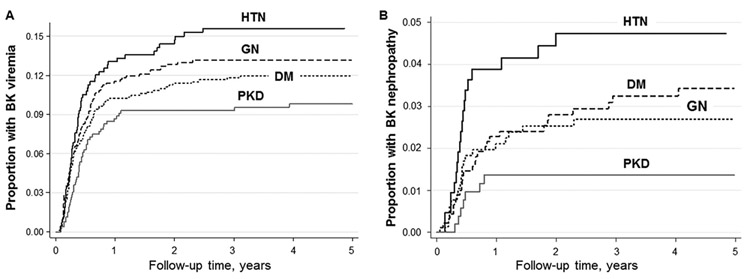
FIGURE 1. Kaplan-Meier curve of the proportion of kidney transplants with BK viremia or BK nephropathy over time, stratified by cause of ESRD.
A, The lowest proportion of patients with post-transplant BK infection was seen in PKD, when stratified by cause of ESRD (P<0.005 for PKD versus HTN, P=0.05 for PKD versus GN, P=0.04 for PKD versus DM). B, When stratified by cause of ESRD, BK nephropathy occurred in the lowest proportion of patients in the PKD group (P=0.003 for PKD versus HTN, P=0.19 for PKD versus GN, P=0.04 for PKD versus DM).
ESRD, end-stage renal disease; GN, glomerulonephritis; DM, diabetes mellitus; HTN, hypertension; PKD, polycystic kidney disease

