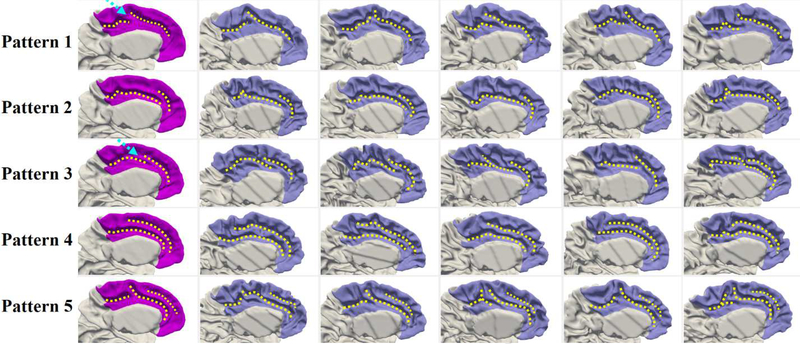
Fig. 12.
Representative patterns of the cingulate cortex. The first column displays the five discovered patterns. Columns 2–6 show five typical individuals for each pattern. In pattern 1 and pattern 3, the dashed arrows point to the locations, where the posterior and middle parts of the cingulate are interrupted.

