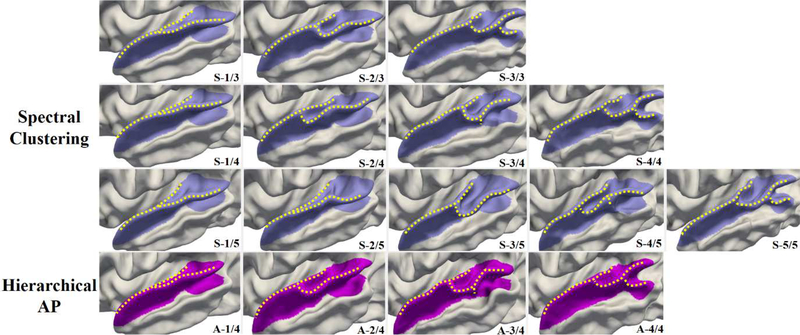
Fig. 8.
Comparison of discovered patterns of the superior temporal gyrus by using spectral clustering (top rows) and hierarchical AP (bottom row). For spectral clustering, the cluster number M is predefined as 3, 4 and 5, and the corresponding discovered folding patterns are shown in the first three rows, respectively. While for the hierarchical AP, the four patterns A-1/4 to A-4/4 automatically emerge without predefining the cluster number.

