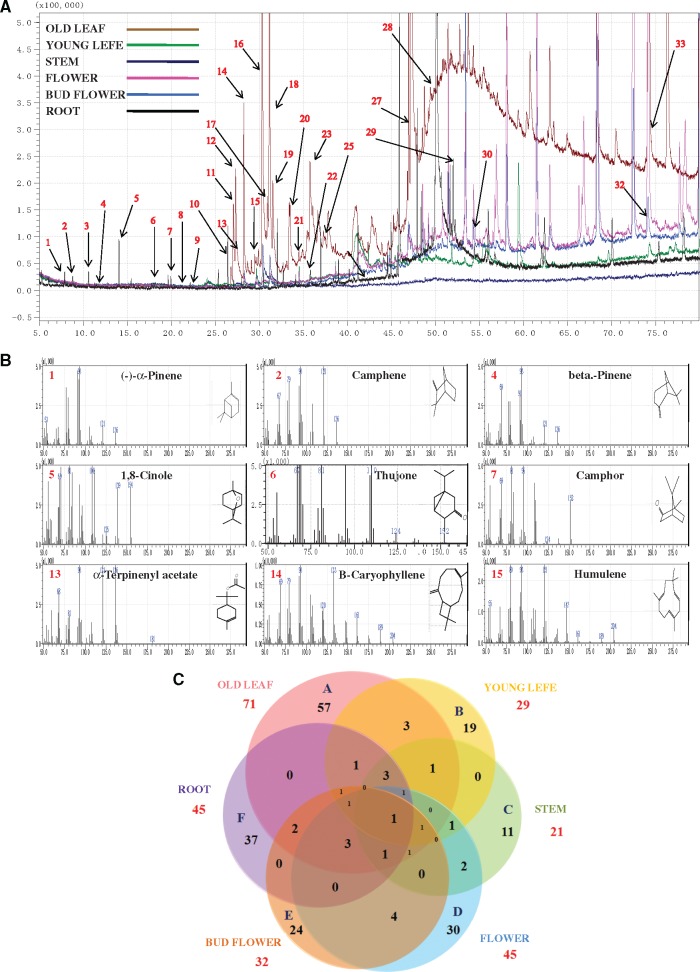
Figure 1.
Typical GC-MS mass spectragraphs for terpenoids from old leaf, young leaf, stem, bud flower, flower and root of S. guaranitica. (A) GC-MS Peak of the essential oil, (B) mass spectrum of GC peak with retention time for the major compound, (C) Six-way Venn diagram to show the number of unique and common compounds in the essential oil extracts from old leaf (A), young leaf (B), stem (C), flower (D), bud flower (E) and root (F) of S. guaranitica.

