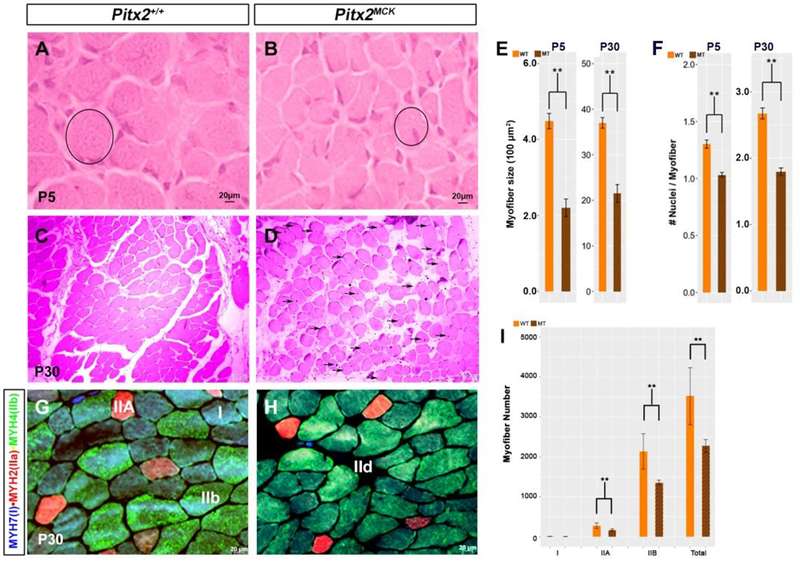
Figure 2. Atrophying muscle in Pitx2MCK mice.
(A-D) Hematoxylin-eosin staining for TA muscle at P5 (A, B) and P30 (C, D). Myofibers became smaller in diameter (circle), with increased inter-myofiber space, and showed centralized nuclei (arrows) (D). (E) Quantitative comparison of myofiber cross sectional area at P5 and P30. Myofibers of H&E stained cross sections were analyzed using ImageJ. Myofibers of ten sequential sections of the entire TA for both genotypes were counted (n=3). (F) Quantitative analysis of nuclei per myofiber cross section at P5 and P30. (G, H) Triple labelling immunohistochemistry of cross sectioned TA at P30 for MYH7, MYH2 and MYH4 to determine fiber types (I) Quantitative analysis of number of myofibers per area of TA at P30. Three sequential sections of the entire TA for both genotypes were used for the quantitation (n=3).

