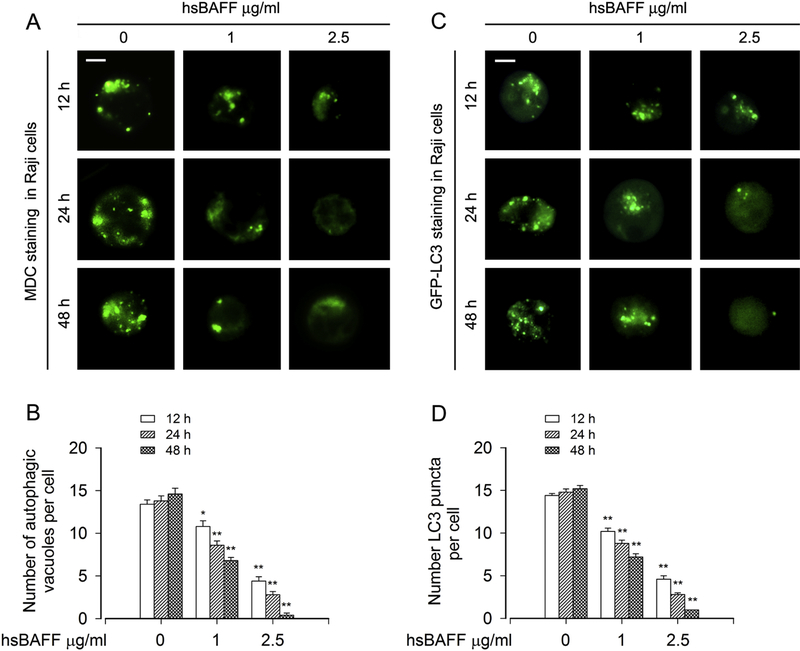
Fig. 1. hsBAFF reduces autophagosome formation in B cells.
Raji cells, or Raji cells infected with Ad-GFP-LC3 were stimulated with hsBAFF (0, 1 and 2.5 μg/ml) for 12, 24 and 48 h, respectively. (A and B) The cells were labeled with MDC (a specific autophagolysosome marker). Then, the MDC-labeled autophagic vacuoles (in green) were photographed (A) and quantified (B) as described in “Materials and Methods”. (C and D) Shown are representative GFP-LC3 fluorescence images (in green) (C) and quantified number (D) for GFP-LC3 puncta in the cells. Scale bar: 2 μm. All quantified data were expressed as mean ± SEM (n = 5). Using one-way ANOVA, *P < 0.05, **P < 0.01, difference vs 0 μg/ml hsBAFF group.

