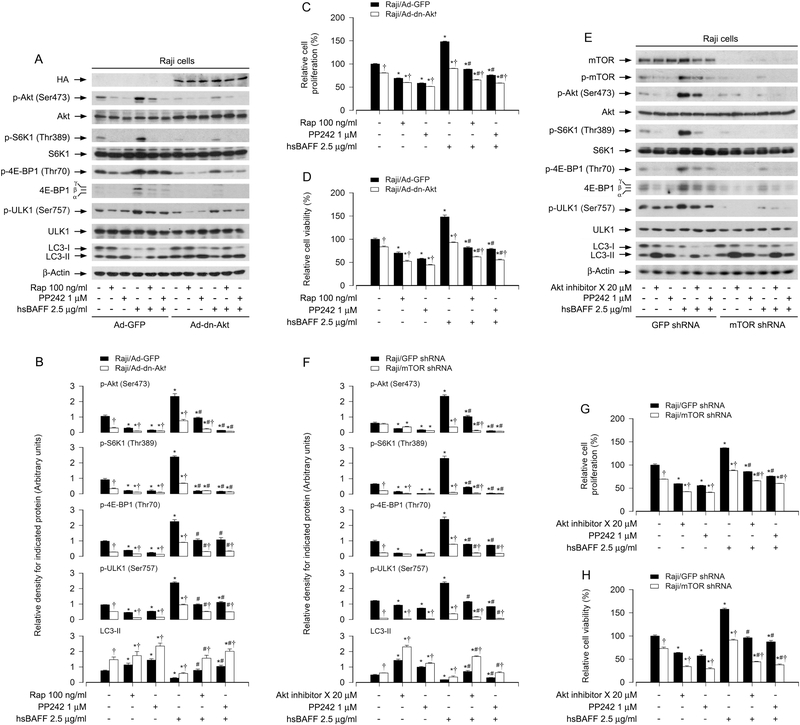
Fig. 5. Ectopic expression of dominant negative Akt or downregulation of mTOR attenuates hsBAFF-induced decrease of LC3-II and increase of cell proliferation/viability in B cells.
Raji cells, infected with Ad-dn-Akt or Ad-GFP (as control), or infected with lentiviral shRNA to mTOR or GFP (as control), respectively, were pretreated with/without rapamycin (Rap) (100 ng/ml) for 2 h, or Akt inhibitor X (20 μM) or PP242(1 μM) for 1 h, then stimulated with/without hsBAFF (2.5 μg/ml) for 12 h (for Western blotting) or 48 h (for cell proliferation/viability assay). (A and E) Total cell lysates were subjected to Western blotting using indicated antibodies. The blots were probed for β-tubulin as a loading control. Similar results were observed in at least three independent experiments. (B and F) The relative densities for p-Akt (Ser473) to Akt, p-S6K1 (Thr389) to S6K1, p-ULK1 (Ser757) to ULK1, and p-4E-BP1 (Thr70), LC3-II to β-actin were semi-quantified using NIH image J. (C and G) The cell proliferation was evaluated by cell counting. (D and H) The cell viability was determined by the MTS assay. All quantified data were expressed as mean ± SE (n = 5). Using one-way ANOVA or Student’s t-test, *P < 0.05, difference vs 0 μg/ml hsBAFF group; #P < 0.05, difference vs 2.5 μg/ml hsBAFF group; †P < 0.05, Ad-dn-Akt group vs Ad-GFP group or mTOR shRNA group vs GFP shRNA group.

