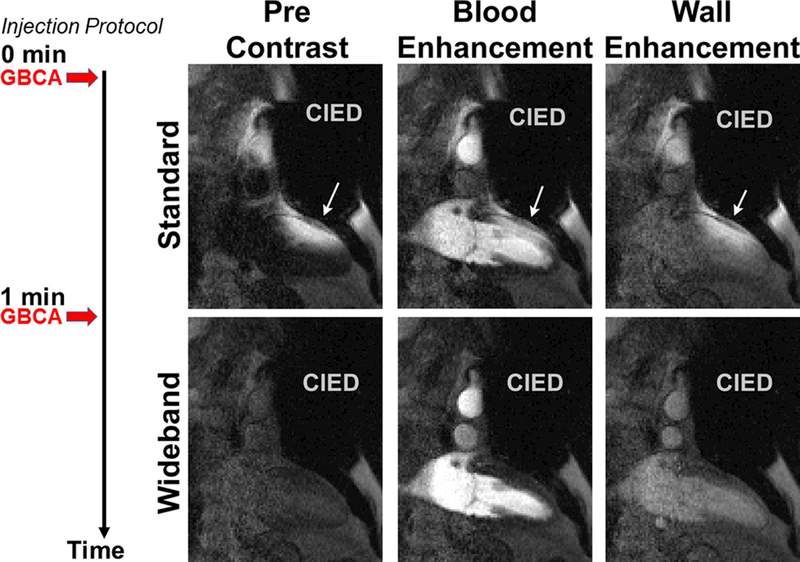
Figure 4.

Representative perfusion image sets in a 2-chamber view where standard perfusion scan was performed first (top row) and wideband perfusion scan was performed second (bottom row): before contrast arrival (left column), at peak blood enhancement (middle column), and at peak myocardial wall enhancement (right column). White arrows point to image artifacts induced by a CIED. A timing diagram displays the injection protocol. GBCA: gadolinium-based contrast agent. See Supporting Information Video S2 for dynamic display.
