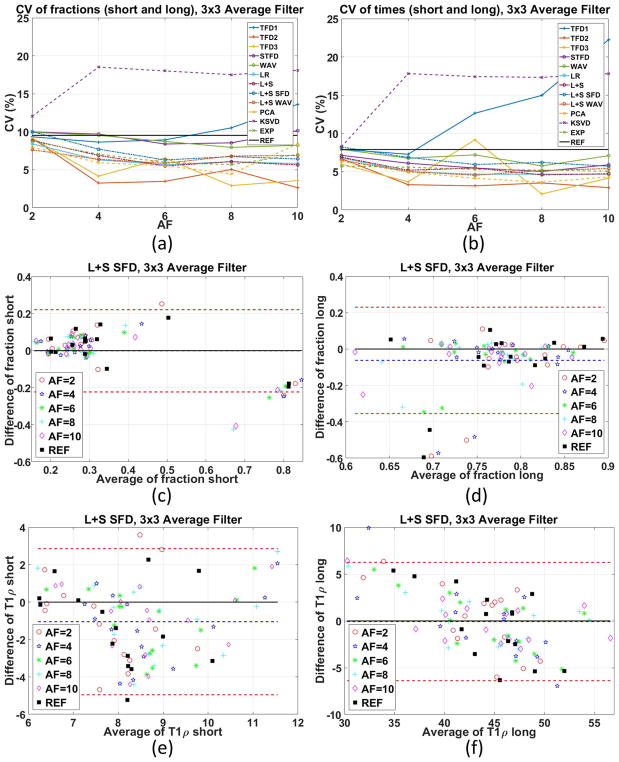
Figure 8.
Coefficient of variation (CV), shown in percentage, of the different methods and acceleration factors with 3×3 averaging filter for (a) fractions, (b) times, considering two repetitions with each of the three volunteers. Bland-Altman plots for the L+S SFD method with 3×3 averaging filter for (c) fraction-short, (d) fraction-long, (e) T1ρ-short, (f) T1ρ-long considered the best in the previous experiment.

