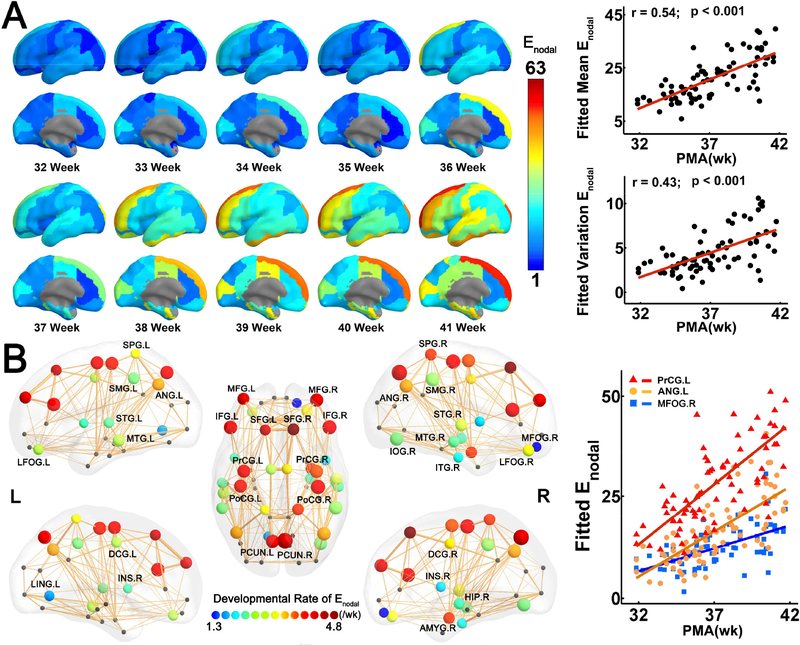
Figure 2.
Heterogeneous development of nodal efficiency (Enodal) across brain regions. (A) On the left panel, fitted nodal efficiency maps at each week from 32 to 41 PMW demonstrate heterogeneous nodal efficiency distribution across the cortical surface. On the right panel, both the mean and standard deviation of nodal efficiency increased significantly with age. (B) On the left panel, 34 brain regions with significant and heterogeneous age-related increases of nodal efficiency are displayed as small spheres with colors (from blue to red) encoding different increase rates of nodal efficiency and sizes encoding the R values of the correlation between the nodal efficiency and age. Scatter plots on the right panel show significant age-related increases in nodal efficiency of three representative regions, namely, PrCG.L, ANG.L and MOFG.R, from highest to lowest efficiency increase rate. Colors of the dots and the fitted lines for each representative region in the scatter plots are consistent with those encoding nodal efficiency increase rates shown on the left panel. Abbreviations: AMYG: amygdala; ANG: angular gyrus; DCG: dorsal cingulate gyrus; FFG: fusiform gyrus; HIP: hippocampus; INS: insular cortex; IOG: inferior occipital gyrus; L/R: left/right; LFOG: lateral fronto-orbital gyrus; MFOG: medial fronto-orbaital gyrus; PCG: posterior cingulate gyrus; PCUN: precuneus; PrCG/PoCG: precentral/postcentral gyrus; SFG/MFG/IFG: superior/middle/inferior frontal gyrus; SMG: supramarginal gyrus; SPG: superior parietal gyrus; STG/MTG/ITG: superior/middle/inferior temporal gyrus.

