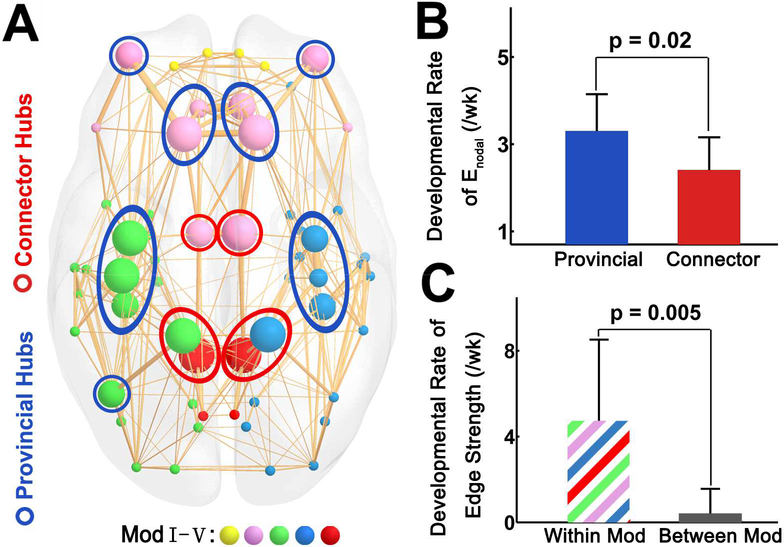
Figure 6.
Higher developmental rates of edge strength of provincial hubs compared with connector hubs, and higher developmental rates of within-module connections compared with between-module connections. (A) A 3D representation of the modular structure of the group-averaged backbone network with nodes in colors corresponding to different modules and size encoding average regional efficiency. Module Ⅰ was composed of bilateral orbital-frontal regions (yellow). Module Ⅱ was composed of bilateral prefrontal regions and dorsal cingulate gyrus (purple). Module Ⅲ mainly consisted of left pre/postcentral gyrus, temporal and superior parietal regions (green). Module Ⅳ mainly consisted of right pre/postcentral gyrus, temporal and parietal regions (blue). Module Ⅴ consisted of bilateral posterior parietal regions (red). The provincial hubs and connector hubs were marked with blue and red circles, respectively. (B) The bar plot showing higher developmental rate of provincial hubs than that of connector hubs. (C) The bar plot showing higher developmental rate of within-module (Within Mod) connections compared with that of between-module (Between Mod) connections.

