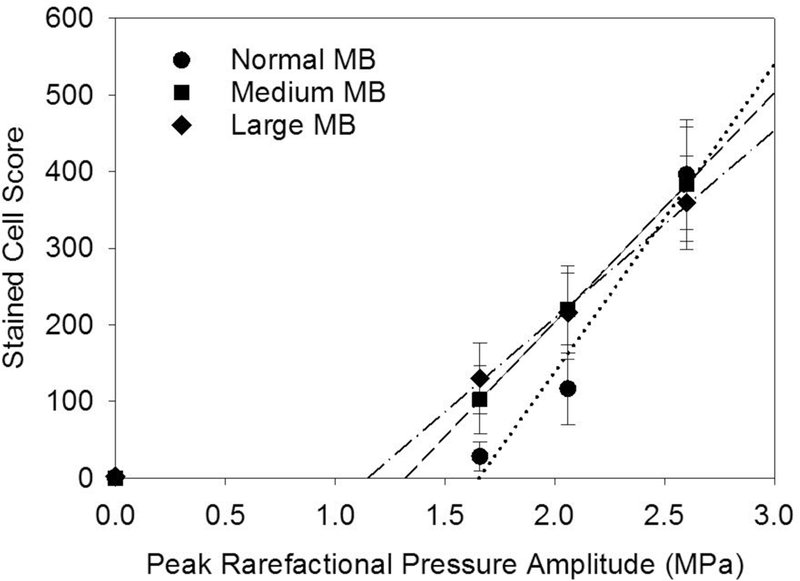
Figure 5.

Plots of the stained cell scores for different peak rarefactional pressure amplitudes for normal, medium and large MB size suspensions. The thresholds (zero crossing) are lower for the larger sizes of MBs than for the normal suspensions (see Table 1).
