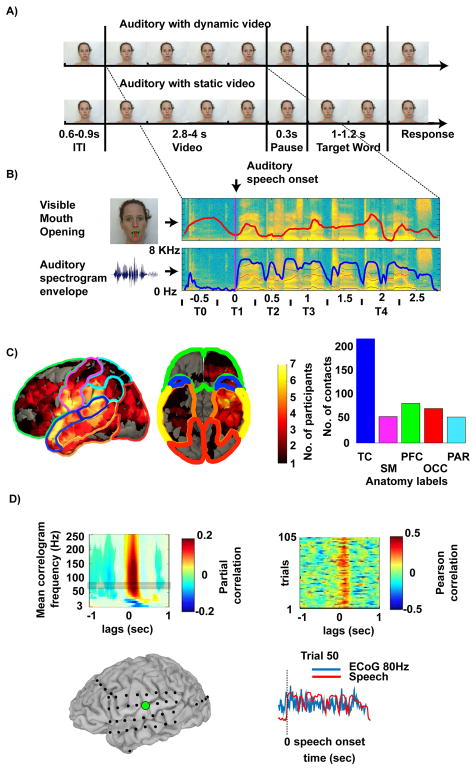
Figure 1.
A) Trial structure: Subjects listened to sentences presented either with the speaker moving the lips (auditory with dynamic video, AVdyn) or with a static image of a speaker (auditory with static video, AVstatic). After a short pause a target word was presented and the subjects had to answer whether the word was present in the previous sentence.
B) Two stimulus features were extracted from the sentence utterance interval: The time-series of the vertical mouth opening (red) and the envelope of the spectrogram (blue). Example time series for one sentence are shown. T0–T4 denote intervals for the time resolved analysis (T0: before audio onset (-0.5 ± 0.25 s), T1: audio speech onset (0 ± 0.25 s), T2: early sentence (0.5 ± 0.25 s), T3: middle sentence (1 ± 0.25 s), T4: late sentence (2 ± 0.25 s)). Note that in the AVdyn condition the speaker may already move her lips prior to auditory speech onset.
C) Location of electrodes for all subjects, projected on a template brain. Over subjects the highest densities are along the STG (blue), inferior somatomotor (magenta), prefrontal (green), occipital (red), and parietal (cyan) cortices, indicated by the hotter colors. TC: temporal cortex, SM: sensory-motor, PFC: pre-frontal, OCC: occipital, PAR: parietal.
D) Correlation between the neural response and the auditory envelope for a representative electrode over pSTG. Frequency resolved correlogram (partial correlations) for a single electrode (top left). The frequency range highlighted in the plot (80 ± 10 Hz) was used for the subsequent panels in D. Single trial correlation (Pearson correlation) across AVdyn trials between the neural response and the auditory envelope for the different lags from −1 to 1 second (top right). Single sentence neural response and auditory envelope time courses (r = 0.49, lag of 160 ms of the auditory envelope compared to the neural response (bottom right).

