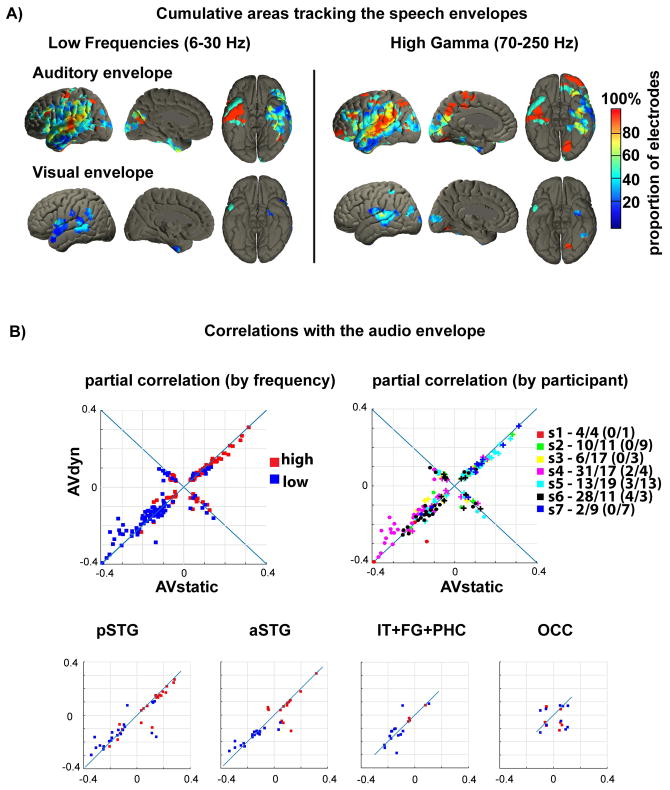
Figure 2.
A) MNI template localization of areas that showed tracking of the auditory speech envelope (upper row) or the envelope of the visible mouth opening (lower row) as revealed by partial correlation. The color coded overlay represents the proportion of electrodes per area with significant tracking, calculated over electrodes from all subjects. Note the high proportions over pSTG and medial occipital cortex, indicating tracking of the auditory and the visual envelope of the speech signal. The effect is more pronounced in the HG- than in the LF-band. Supplementary figure 1 reports the absolute number of participants with significant electrodes and figure 1C shows the proportion of participants which had electrode coverage in an area.
B) Upper row: The panels show the maxima of partial correlations for all significant electrodes. Each point corresponds to one electrode (electrodes can appear twice in the low and high frequencies). Left: positive correlations are distributed mainly in the HG band (red), negative correlations in the LF band (blue). Right: correlations distinguished by subject. The colors on the right indicate the different subjects (s1 to s7). Crosses indicate HG band and dots LF band. The numbers indicate significant electrodes per subject in the LF/HG bands. The numbers in parentheses indicate the electrodes in the positive quadrant. Lower row: significant electrodes in different cortical areas differentiated per band. Acronyms: pSTG: posterior STG, aSTG: anterior STG, IT+FG+PHC: inferior temporal, fusiform gyrus, parahippocampal cortex, OCC: occipital cortex.

