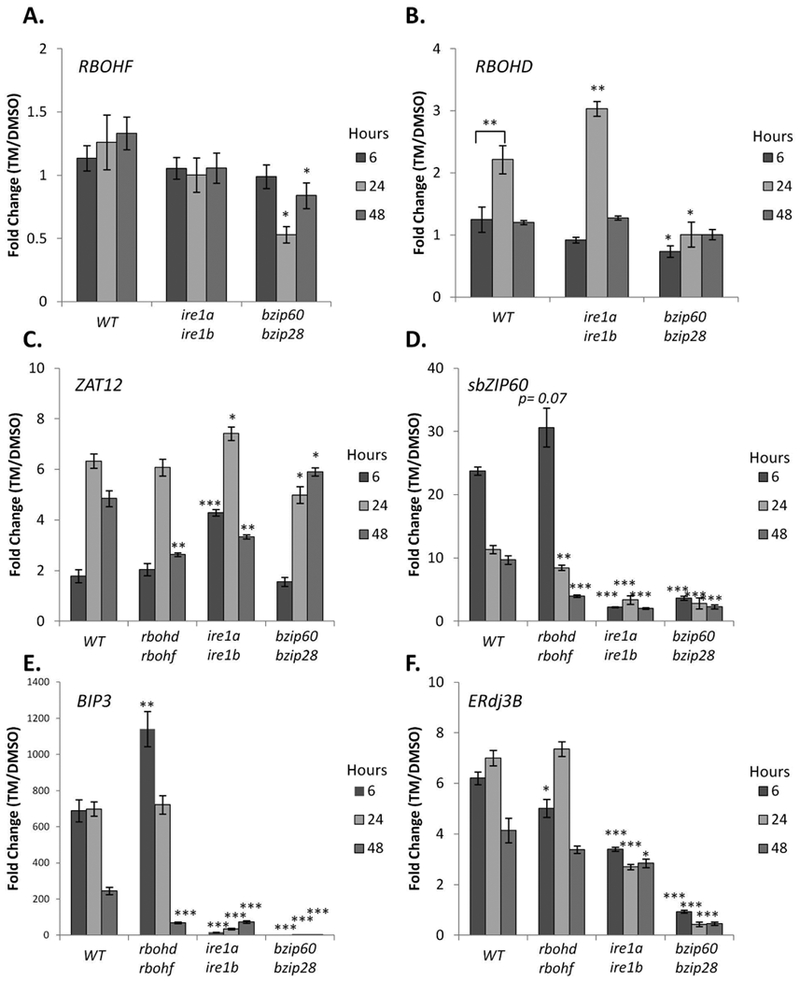
Figure 3. Intact UPR signaling is required to maintain homeostasis of RBOH transcript levels and ROS signaling, while RBOH activity affects UPR homeostasis.

Time course gene expression analysis of WT, rbohd rbohf, ire1a ire1b, and bzip60 bzip28 seedlings subjected to ER stress. qRT-PCR analyses were performed using primers specific for either RBOHF (A), RBOHD (B), ZAT12 (C), spliced bZIP60 (sbZIP60; D), BIP3 (E), or ERdj3B (E). Data represent the mean ratio ± SE (biological replicates=3); Statistical significance compared to equivalent WT value, unless a bracket is used to indicate comparison. Statistical significance determined using Student’s unpaired t-test and indicated by: *=p<0.05, **=p<0.005 ***=p<0.005, NS=not significant.
