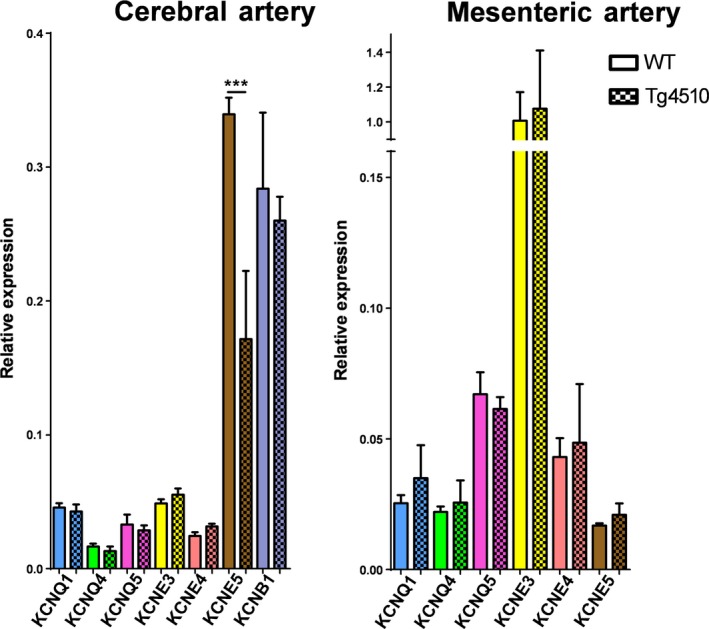
Figure 2.

qPCR analysis of specific KCNQ and KCNE isoforms in cerebral arteries and mesenteric arteries of WT and Tg4510 mice (n = 3 for each point). Differences in individual gene expression between WT and Tg4510 mice were compared using a one‐way ANOVA followed by a Bonferroni multiple comparisons test (* and *** denote significance of P < 0.05 and P < 0.001, respectively).
