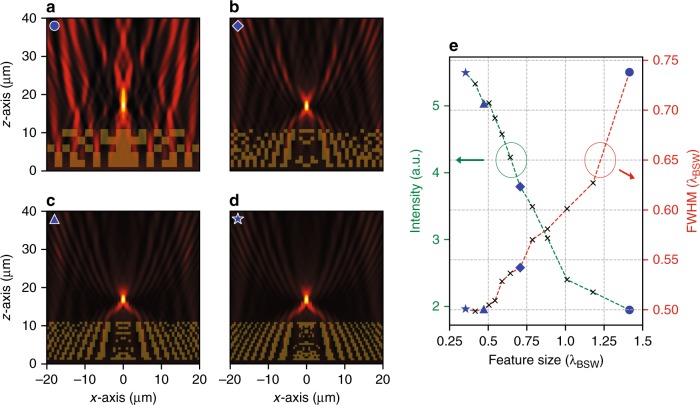
Fig. 2. Optimization of different structures that can focus BSWs at some distance behind the functional element, i.e., 5 µm in the present case.
On the left (a–d), we show the electric field intensity distributions upon illuminating optimized elements with a plane wave for selected spatial discretization of the structures. The optimized structures are shown as an overlay. The considered grid size corresponds to a 2 μm (=1.414 λBSW), b 1 μm (=0.707 λBSW), c 667 nm (=0.471 λBSW), and d 500 nm (=0.354 λBSW), respectively. e We show the achievable focal width and peak intensity at the focal point of the elements as a function of the feature size of the grid. Selected data points correspond to the samples shown in a–d as marked by the symbol in the top left corner of each intensity distribution

