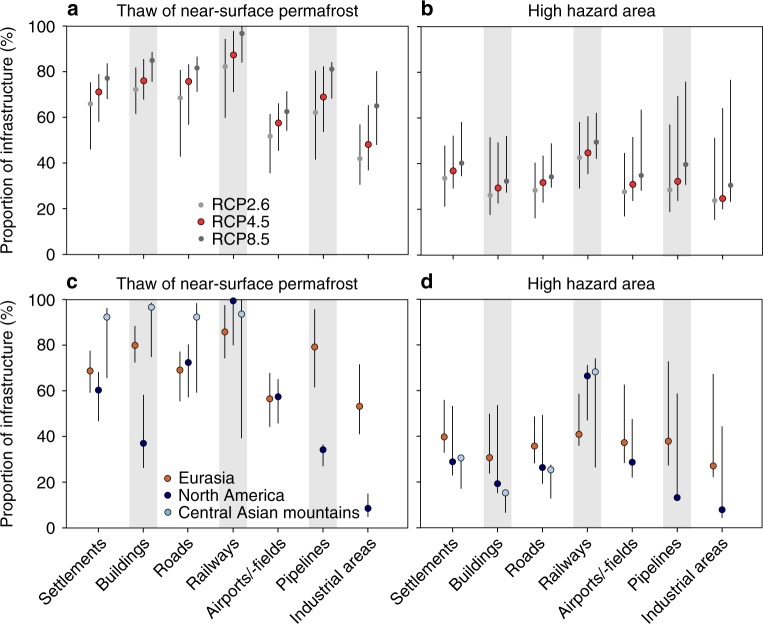
Fig. 2.
Central results of the infrastructure hazard computations. Proportion of all residential, transportation, and industrial infrastructure in areas of near-surface permafrost thaw (a) and high hazard (b) in the pan-Arctic permafrost area based on different Representative Concentration Pathway (RCP) scenarios by the middle of the century (2041–2060). The comparable results of RCP4.5 for geographical sub-regions (Eurasia, North America and central Asian mountains) are presented in (c) and (d) (also 2041–2060; percentages for airports/-field, pipelines and industrial areas are not shown for central Asian mountains owing to too few observations). The numerical results are presented in Supplementary Table 3. The uncertainty ranges (bars) were based on the uncertainty in the mean annual ground temperature (a–d) and active layer thickness predictions (b and d)

