Figure 3.
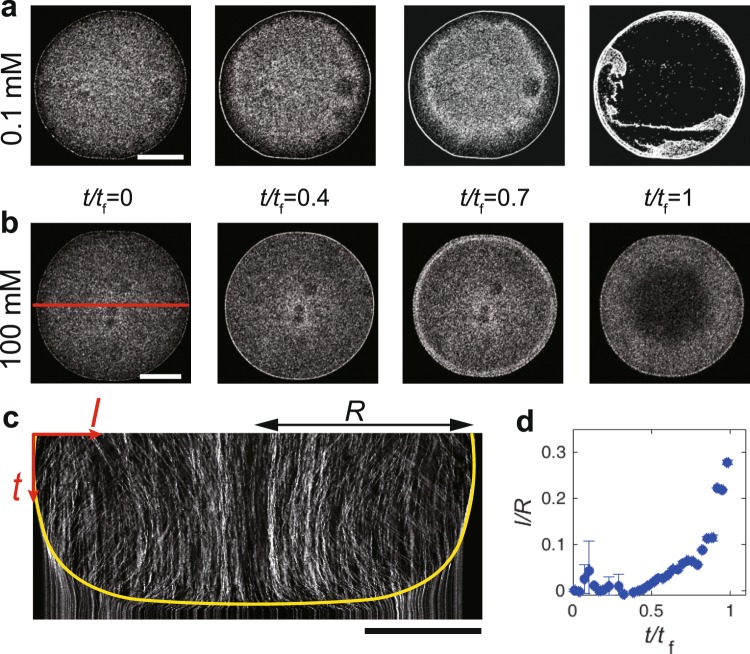
(a,b) Sequential fluoresce images near the bottom during the evaporation of a drop (0.5 μl, 0.01 vol%) of particle suspension with = 0.1 and 100 mM. The scale bars are 500 μm. (c) Spatio-temporal image of the red-solid line in (b). The yellow line is the eye guide of the receding front toward the center. The particles do not move below the line. The scale bars are 500 μm. (d) Distance of the receding front from the droplet edge normalized by the droplet radius, l/R, as a function of normalized time, t/tf, where l and R are the distance of the receding front from the edge and the droplet radius, respectively.

