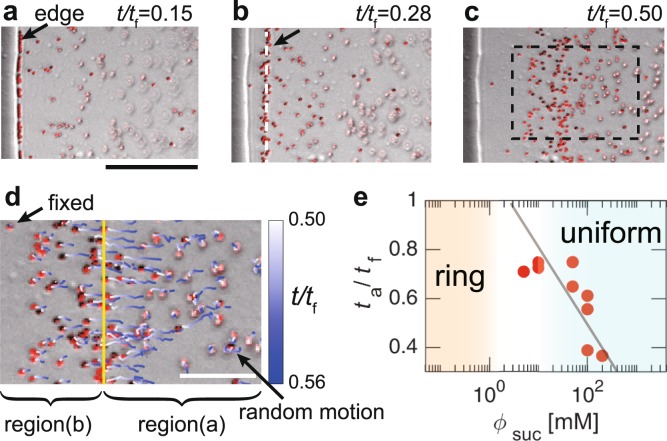
Figure 4.
(a–c) Sequential images near the contact line of a drop with = 100 mM at t/tf = (a) 0.15, (b) 0.28 and (c) 0.50, where tf is the total evaporation time. The fluoresce images are merged with bright-field ones. The scale bar is 50 μm. The arrow and white dashed line in (b) show the front of the particles that move towards the centre from the edge. The arrow in (a) indicates the edge of the solid-like sucrose. (d) Particle trajectories are shown by time-dependent colour lines in the rectangle in (c) from t/tf = 0.50 to t/tf = 0.56. The yellow line indicates the front. Regions (a and b) show the inner and outer regions divided by the front, respectively. The scale bar is 20 μm. (e) The normalized time at which the particles start to move inward from the edge, ta/tf, as a function of . The line is a visual guide.

