Figure 5.
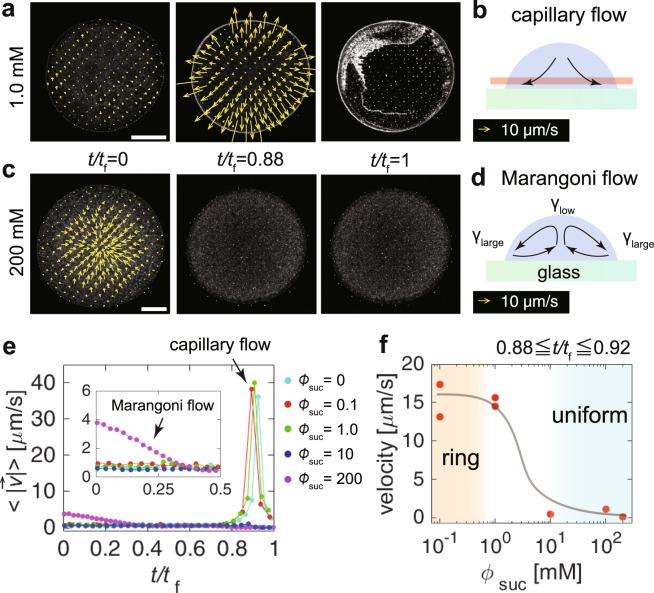
(a,c) Flow fields of drops (0.5 μl, 0.01 vol%) with = (a) 1.0 and (c) 200 mM. The scale bars are 500 μm. (b,d) Schematic of (b) the evaporatively driven capillary flow and (d) the sugar driven solutal Marangoni flow. The arrows represent the flow pattern. The analysis was done near the substrate as shown by the red-shaded region. (e) The velocity magnitude averaged over the drops ( = 0, 0.1, 1, 10 and 200 mM) as a function of normalized time t/tf. The arrow indicates the capillary flow that rapidly grows at t/tf ~ 0.9. The inset shows the first half and the arrow in the inset shows the Marangoni flow driven by the surface-inactive sucrose in a drop with = 200 mM. (f) The average velocity in the time span as a function of . The black line is a visual guide.

