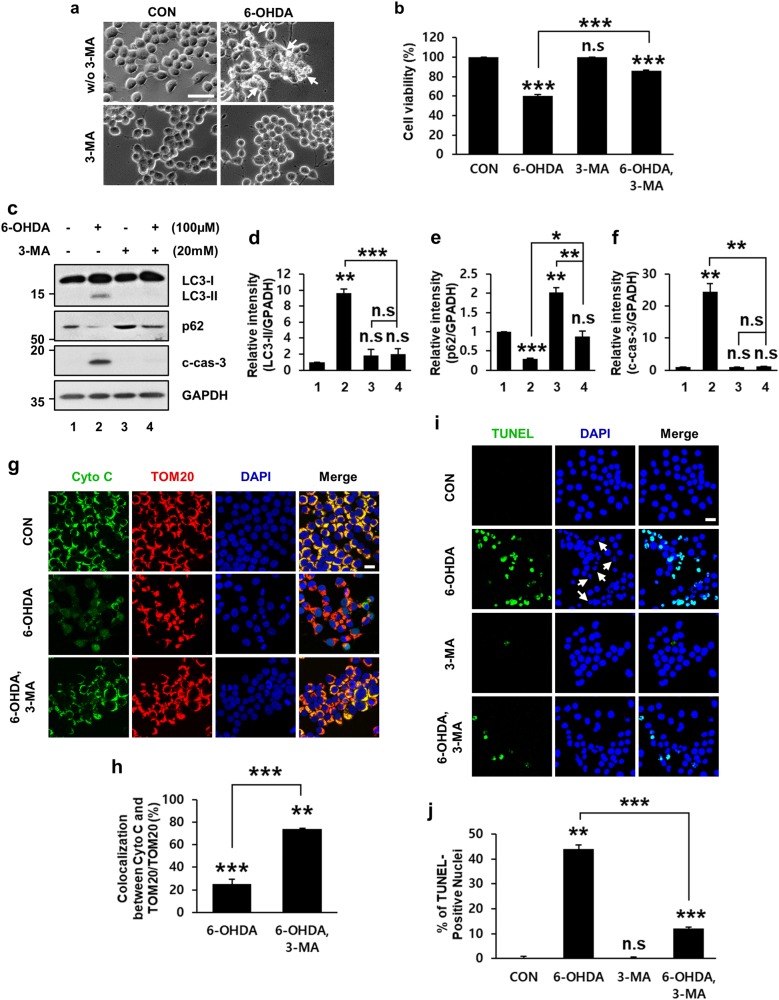
Fig. 5. Rescue of 6-OHDA-induced neurodegeneration by 3-metyladenine (3-MA).
MN9D cells were treated for 12 h with or without 100 μM 6-OHDA or 20 mM 3-MA alone or in combination. a Cells were analyzed by phase-contrast microscopy. Shrunken, phase-bright cells are indicated by white arrows. Scale bar represents 100 μm. b MTT reduction assays were performed to assess cell viability expressed as percentage over the untreated control cells (100%; 60.4 ± 1.3% for 6-OHDA-treated vs. 85.8 ± 0.8% for 6-OHDA plus 3-MA-treated cells). Bars represent the mean ± standard deviation of three independent experiments. ***P < 0.001; n.s. not significant. c Cell lysates were subjected to immunoblotting using anti-LC3, anti-p62 and anti-c-cas-3 antibodies. d−f After normalization against GAPDH, densitometric values of LC3-II, p62, and c-cas-3 signals were expressed as a fold change relative to untreated control value. Bars represent the mean ± standard deviation of three independent experiments (LC3-II, 9.6 ± 0.5 for 6-OHDA-treated vs. 1.9 ± 0.7 for 3-MA-treated vs. 2.0 ± 0.7 for 6-OHDA plus 3-MA-treated cells; p62, 0.3 ± 0.01 for 6-OHDA-treated vs. 2.0 ± 0.1 for 3-MA-treated vs. 0.9 ± 0.1 for 6-OHDA plus 3-MA-treated cells; c-cas-3, 24.6 ± 2.5 for 6-OHDA-treated vs. 0.9 ± 0.04 for 3-MA-treated vs. 1.1 ± 0.2 for 6-OHDA plus 3-MA-treated cells). *P < 0.05; **P < 0.01; ***P < 0.001; n.s. not significant. g, i Confocal images of cytochrome c (cyto c, green), TOM20 (red) and TUNEL staining (green) in MN9D cells treated with 100 μM 6-OHDA alone or in combination with 20 mM 3-MA were shown. Nuclei were counterstained with Hoechst 33258 (blue). Merged images are shown in the right panel. White arrows indicate condensed or fragmented nuclei. Scale bar represents 20 μm. h The percentage of colocalization between cyto c and TOM20 over total TOM20 was expressed over the untreated control cells (100%). Confocal images of at least 30 randomly selected cells from each of the three independent experiments we used for quantitation. Bars represent the mean ± standard deviation of three independent experiments (25.4 ± 1.1% for 6-OHDA-treated vs. 74.1 ± 0.9% for 6-OHDA plus 3-MA-treated group). **P < 0.01; ***P < 0.001. j The percentage of TUNEL-positive nuclei was assessed from at least 100 randomly selected cells from each of the three independent experiments. Data were shown as the mean ± standard deviation of three independent experiments (0.4 ± 0.4% for untreated vs. 44.0 ± 1.7% for 6-OHDA-treated vs. 0.3 ± 0.2% for 3-MA-treated vs. 12.0 ± 0.6% for 6-OHDA plus 3-MA-treated cells). **P < 0.01; ***P < 0.001; n.s. not significant

