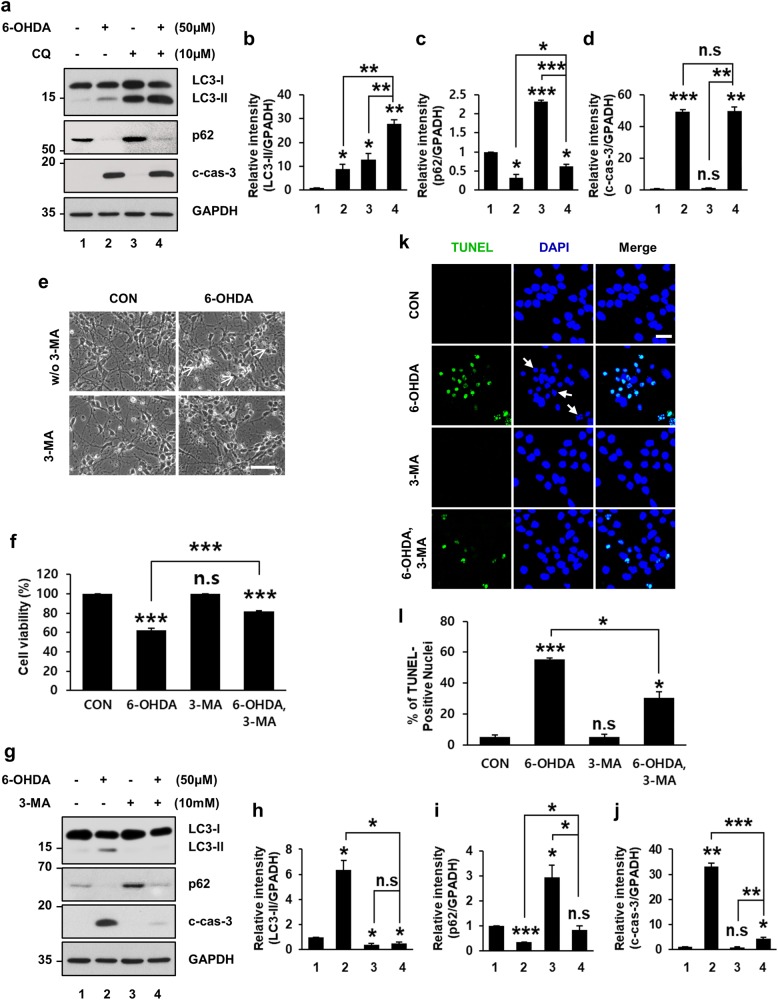
Fig. 7. Rescue of 6-OHDA-induced cortical neuronal death by 3-MA.
Primary cultures of mouse cortical neurons were incubated for 12 h with 50 μM 6-OHDA in the presence or absence of 10 μM CQ (a−d) or 10 mM 3-MA (e−l). a Cell lysates were subjected to immunoblotting using antibodies against LC3, p62, and c-cas-3. b−d After normalization against GAPDH signal intensity, the fold intensity of LC3-II, p62, and c-cas-3 signals were expressed as fold change relative to control value. Data represent the mean ± standard deviation of three independent experiments (LC3-II, 9.0 ± 1.8 for 6-OHDA-treated vs. 12.9 ± 2.4 for CQ-treated vs. 27.7 ± 1.7 for 6-OHDA plus CQ-treated cells; p62, 0.3 ± 0.1 for 6-OHDA-treated vs. 2.3 ± 0.03 for CQ-treated vs. 0.6 ± 0.1 for 6-OHDA plus CQ-treated group; c-cas-3, 49.5 ± 1.2 for 6-OHDA-treated vs. 1.2 ± 0.1 for CQ-treated vs. 49.6 ± 2.8 for 6-OHDA plus CQ-treated group). *P < 0.05; **P < 0.01; ***P < 0.001; n.s. not significant. e Mouse primary cortical neurons were analyzed by a phase-contrast microscopy after drug treatment. Shrunken, phase-bright cells are indicated by white arrows. Scale bar represents 50 μm. f Cell viability was measured by the MTT reduction assay. Viability was expressed as percentage over the untreated control cells (100%; 62.0 ± 2.2% for 6-OHDA-treated vs. 82.1 ± 0.3% for 6-OHDA plus 3-MA-treated group). Bars represent the mean ± standard deviation of three independent experiments. ***P < 0.001; n.s. not significant. g The levels of LC3-II, p62, and c-cas-3 were determined by immunoblotting. h−j The relative intensities of LC3-II, p62, and c-cas-3 signals were calculated after normalization against GAPDH signal intensity. Bars represent the mean ± standard deviation of three independent experiments (LC3-II, 6.3 ± 0.8 for 6-OHDA-treated vs. 0.4 ± 0.1 for 3-MA-treated vs. 0.5 ± 0.1 for 6-OHDA plus 3-MA-treated group; p62, 0.3 ± 0.001 for 6-OHDA-treated vs. 3.0 ± 0.5 for 3-MA-treated vs. 0.9 ± 0.1 for 6-OHDA plus 3-MA-treated group; for c-cas-3, 33.2 ± 1.3 for 6-OHDA-treated vs. 0.9 ± 0.2 for 3-MA-treated vs. 4.4 ± 0.5 for 6-OHDA plus 3-MA-treated group). *P < 0.05; **P < 0.01; ***P < 0.001; n.s. not significant. k TUNEL assay was performed in primary cultures of mouse cortical neurons exposed to 50 μM 6-OHDA for 18 h in the presence or absence of 10 mM 3-MA. White arrows indicate condensed or fragmented nuclei. Scale bar represents 20 μm. l The percentage of TUNEL-positive nuclei was assessed from at least 100 randomly selected cells from each of the three independent experiments. Data represent the mean ± standard deviation of three independent experiments (5.4 ± 1.3% for untreated vs. 55.6 ± 0.8% for 6-OHDA-treated vs. 5.2 ± 1.9% for 3-MA-treated vs. 30.5 ± 3.8% for 6-OHDA plus 3-MA-treated group). *P < 0.05; ***P < 0.001, n.s. not significant

