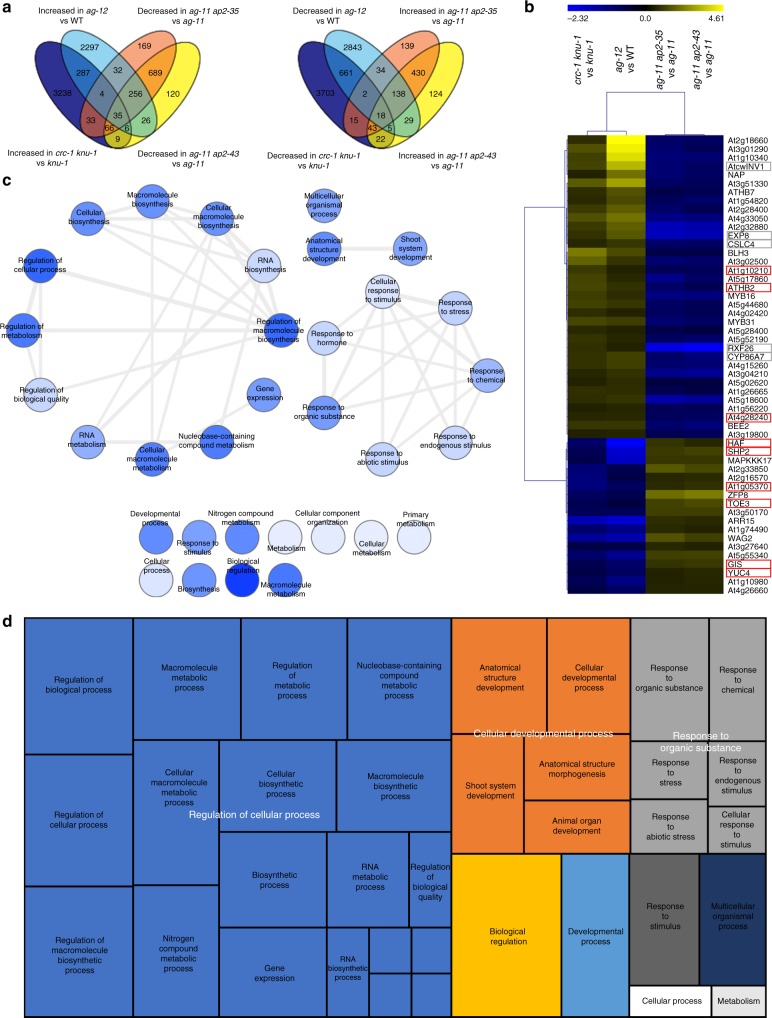
Fig. 1.
Identification of downstream targets of AG and CRC during flower development. a Venn diagrams showing the overlap between genes with increased/decreased expression in crc-1 knu-1 vs knu-1 and ag-12 vs WT, and genes with decreased/increased expression in ag-11 ap2-35 vs ag-11 and ag-11 ap2-43 vs ag-11. b Hierarchical clustering of 53 genes downstream of AG and CRC. The heat map displays the log2 fold change of differentially expressed genes based on public datasets. Red and gray boxes highlight AG direct targets and cell wall regulators, respectively. c Interactive graph view generated by REVIGO. Dark and light colors indicate lower and higher p-values, respectively. Circle sizes indicate the frequency of the GO term in the underlying GOA database. d TreeMap view of GO terms

