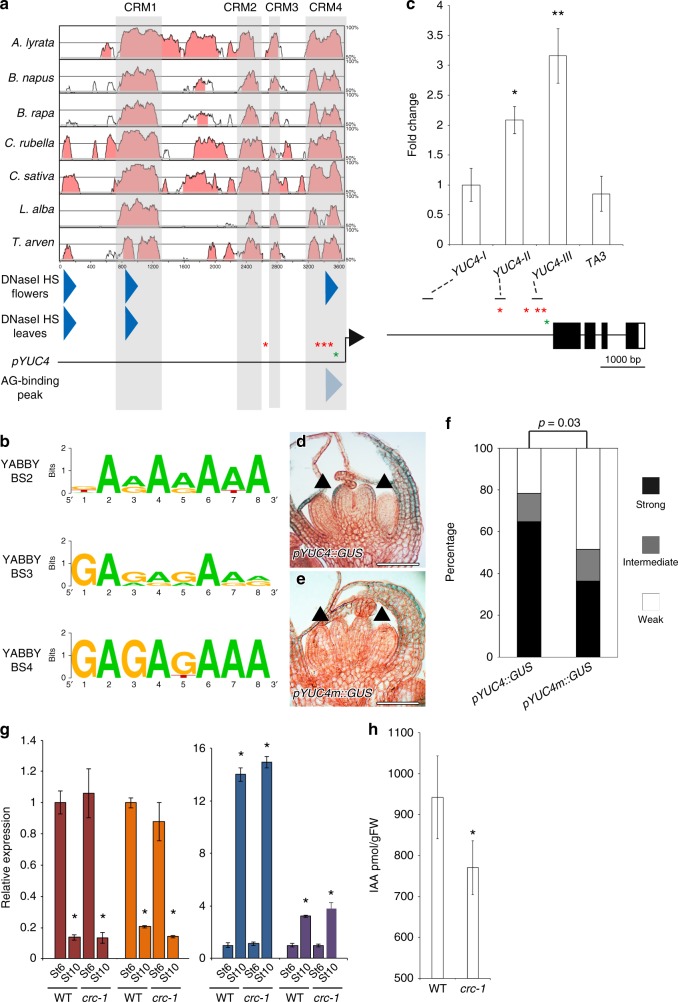
Fig. 3.
CRC binds to the YUC4 promoter and controls auxin accumulation a Pairwise alignment created by mVISTA of the 5′ upstream intergenic region of the YUC4 promoter using seven Brassicaceae species. Four regions (gray: CRM1, CRM2, CRM3, and CRM4) are conserved in the YUC4 promoter. Blue triangles indicate DNase I hypersensitive sites. Red and green asterisks indicate CRC binding sites and a possible CArG box (C[C/T][A/T]G[A/G][A/T]6[A/G]G) within an AG binding peak, respectively. The binding region was shown by pale blue triangle. b Conservation of CRC binding sites among Brassicaceae species. The diagram was generated by Weblogo. c Mapping of the CRC-myc protein to the YUC4 locus. ChIP using anti-myc in synchronized gCRC-myc floral buds at stage 6 in the ap1 cal background. The bottom section indicates the location of ChIP-qPCR amplicons tested. Red and green asterisks indicate CRC binding sites and possible CArG box, respectively. The values are represented as the means ± SEMs. p-values were calculated with a two-tailed Student’s t-test. *p < 0.05 compared to the TA3 signal. **p < 0.01 compared to the TA3 signal. d, e Reporter gene expression in the wild-type and YABBY-binding site-mutated YUC4 promoter. GUS expression in stage 6 floral buds under control of the YUC4 promoter with (d) or without (e) intact YABBY-binding sites. Arrowheads indicate abaxial side of epidermal cells in carpels at stage 6. f Visual scoring of pYUC4::GUS or pYUC4m::GUS staining in the T1 population; n > 32 for each construct tested. p-values were calculated with a χ2 t-test. g mRNA abundance of marker genes, CLV3 (red), LFY (orange), PAL4 (blue), and COMT (purple) in wild-type and crc-1 floral buds up to stage 6 and stage 10. The values are represented as the means ± SEMs. p-values were calculated with a two-tailed Student’s t-test. *p < 0.05 compared to the signals at stage 6 in the same genetic backgrounds. h The amount of IAA in WT and crc-1 mutants determined by liquid chromatography-tandem mass spectrometry. Floral buds up to stage 8 were used for this assay. The values are represented as the means ± SEMs. p-values were calculated with a two-tailed Student’s t-test. *p < 0.05 compared to the wild type. Bars = 50 µm in d, e

