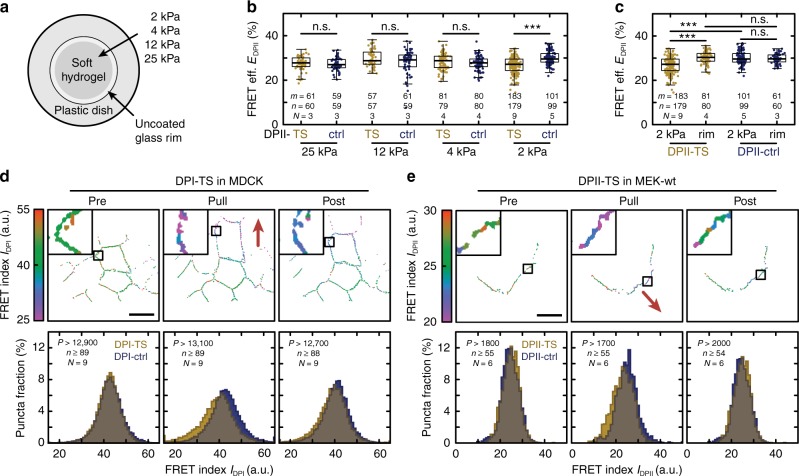
Fig. 3.
DP is mechanically loaded on soft hydrogels and in response to external force. a Hydrogels of defined stiffness were located in the center of a glass-bottom microscopy dish. b No FRET efficiency differences between DPII-TS (yellow) and DPII-ctrl (blue) were observed for 25, 12, and 4 kPa substrates, but DPII-TS showed a significant decrease in FRET efficiency for 2 kPa substrates. c The FRET efficiency decrease for DPII-TS on 2 kPa substrates is specific to cells cultured on the hydrogel. FRET efficiencies in cells on the uncoated glass rim surrounding the hydrogel were indistinguishable for DPII-TS and DPII-ctrl. d Top row: Example FRET index measurements for individual puncta of DPI-TS in an MDCK monolayer before (Pre), during (Pull), and after (Post) the application of external mechanical stress using a glass micropipette (the red arrow indicates pulling direction). Bottom row: FRET indices of DPI-TS (yellow) and DPI-ctrl (blue) were indistinguishable before pulling, but decreased specifically for DPI-TS during force application; the DPI-TS decrease partially recovered after relaxation. e Top row: Example FRET index measurements for DPII-TS expressed in a monolayer of MEK-wt in the course of a pulling experiment. Bottom row: Per-punctum FRET indices for cells expressing DPII-TS (yellow) and DPII-ctrl (blue) in confluent sheets of MEK-wt one day after DSM induction were indistinguishable before pulling. DPII-TS FRET indices were specifically reduced during pulling and returned to pre-pull levels after relaxation. b, c FRET efficiencies were determined via bulk fits. Numbers of manual masks (m), images (n), and independent experiments (N) are indicated in the figure. Boxplots show median, 25th and 75th percentile with whiskers reaching to the last data point within 1.5× interquartile range. Kolmogorov–Smirnov test: ***p < 0.001, n.s. (not significant) p ≥ 0.05. d, e Numbers of puncta (P), images (n), and independent experiments (N) are indicated in the figure. Scale bars: 20 μm. Source data are provided as a Source Data file

