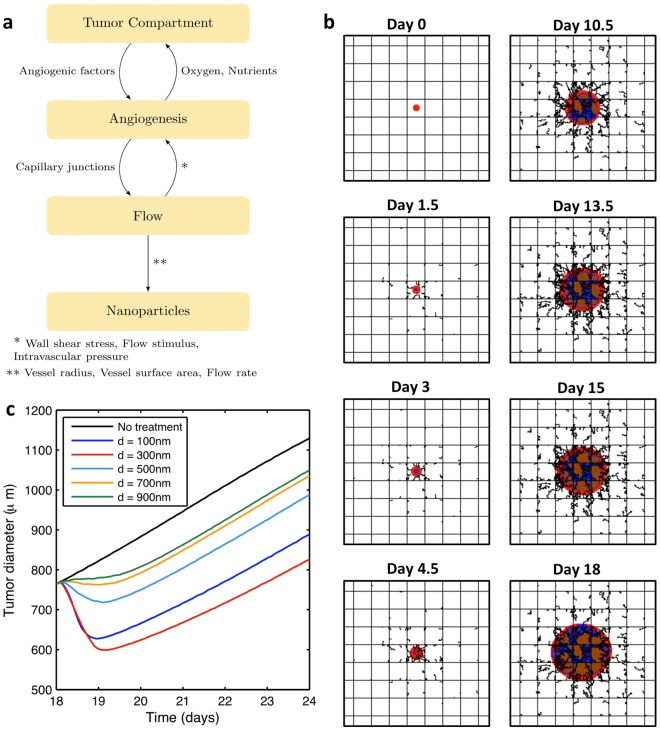
Figure 1.
Tumor model used for analysis. (a) Interaction among the different submodels as described in16. (b) Simulated tumor formation due to loss of growth control using the computational model. Viable, necrotic, and hypoxic tissues are represented in red, blue, and brown respectively. Preexisting capillary vessels are represented by the straight orthogonal lines where blood enters from lower left corner to the upper right corner, and flows into the tissue supplying it with oxygen and nutrients. New blood vessels created by the process of angiogenesis are illustrated by irregular lines that sprout from the preexisting vessels. The panel dimensions are 2 × 2 mm. (c) Tumor regression in the treatment phase using different nanoparticle diameters. The treatment phase starts after 18 days of tumor growth.

