Fig. 2.
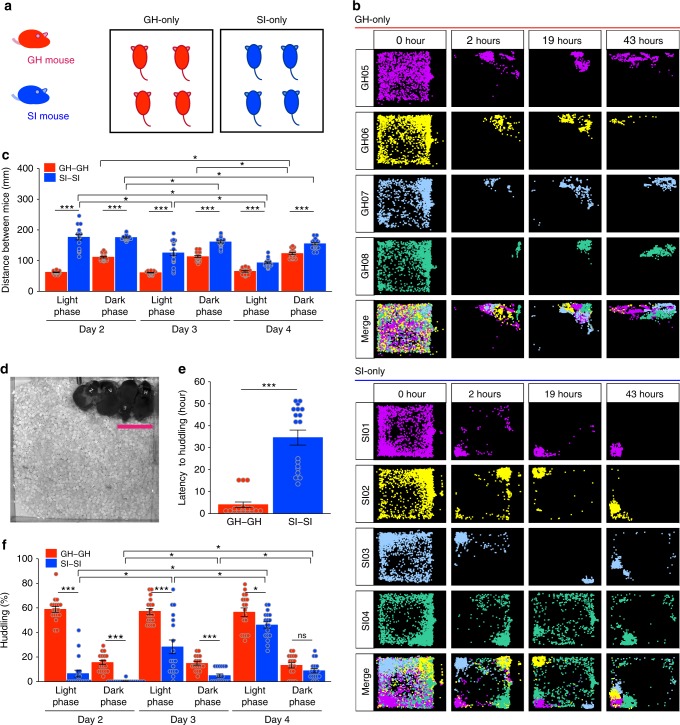
Huddling behaviour in the group-housed-only and socially isolated-only housing conditions. a Experimental design for the group-housed (GH) mice-only and socially isolated (SI) mice-only housing conditions. Four unrelated group-housed or socially isolated mice were housed per chamber (total n = 12 for each type). b Representative position plots over time for group-housed (upper panel) or socially isolated (lower panel) mice. c Inter-individual distances between group-housed pairs (GH-GH) and socially isolated pairs (SI-SI). For this index, we analysed the distance between every possible mouse pair, yielding 6 pairs in each experimental chamber (n = 18 total pairs in 3 chambers for each mouse type). Data are shown as mean ± SE and evaluated by three-way repeated measures ANOVA (group-housed pair vs. socially isolated pair). d A representative video still of huddling behaviour. Scale bar = 60 mm. e Latency to first huddle for group-housed (GH-GH) and socially isolated (SI-SI) pairs. Data are shown as mean ± SE and analysed by Welch two sample t-test (group-housed pair vs. socially isolated pair, n = 18 pairs each). f Huddling behaviour of group-housed pair mice and socially isolated pairs during light and dark phase (12-h epochs) on Days 2–4. The fraction of time spent in huddling behaviour was calculated as the percentage of 30-min bins spent huddling. See methods for more detail. Three-way repeated measures ANOVA followed by simple effects analysis for c, and permutation test, with one-way and with 1 between (Group) × 2 within (Day, Light/Dark) ANOVA models for e or f, respectively. *p < 0.05, **p < 0.01, ***p < 0.001

