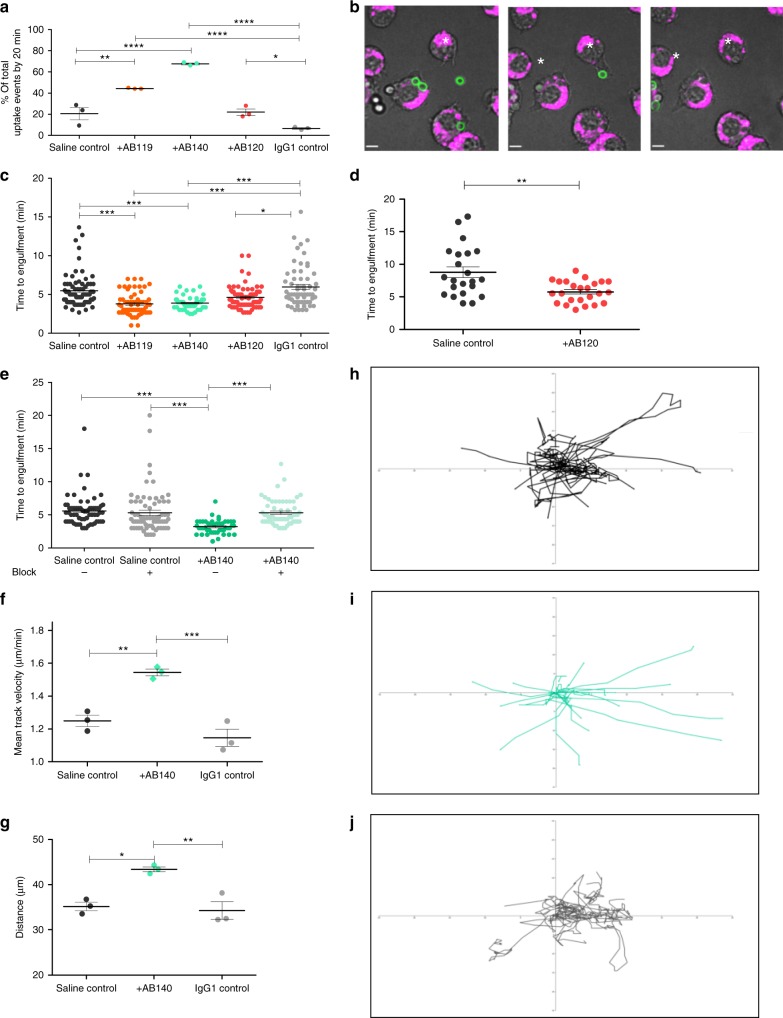
Fig. 8.
Effect of anti-Candida mAbs on macrophage phagocytosis of live C. albicans cells. a Percentage of uptake events that occurred within the first 20 min of the assay following C. albicans pre-incubation with saline, an IgG1 control antibody, an anti-whole cell reactive mAb (AB119 and AB140) or an anti-Hyr1 mAb (AB120). An uptake event was defined as the complete engulfment of a C. albicans cell by a macrophage. Dots represent single experiments and horizontal lines represent mean percentage of uptake events ± SEM (n = 3). b Snapshot images taken from live cell video microscopy capturing the stages of C. albicans engulfment by J774.1 macrophages. (left) Macrophage (magenta, *) and C. albicans (green) prior to cell–cell contact; (middle) macrophage and yeast cell once contact has been established and (right) C. albicans within the phagocyte following ingestion. Scale bar represents 6 µm. c Average time taken for a macrophage to engulf a live C. albicans cell following pre-incubation with saline, IgG1 control or anti-Candida mAb. d Average time taken for a macrophage to ingest a filamentous C. albicans cell following pre-incubation with saline or AB120. e Average time taken for a macrophage to ingest a live C. albicans cell following pre-incubation with saline or AB140 in the presence or absence of an FcγR block. c, d, e Dots represent individual uptake events from three experiments; horizontal lines represent mean time taken ± SEM (n = 3). f Mean velocity of and g average distance travelled by macrophages during migration towards C. albicans cells following pre-incubation with saline, an IgG1 control mAb or AB140. Dots represent single experiments and horizontal lines represent means ± SEM (n = 3). h–j Tracking diagrams representing macrophage migration towards C. albicans cells pre-incubated with saline (h), AB140 (i) or IgG1 control mAb (j). Tracks represent the movement of individual macrophages relative to their starting position, until the first uptake event. Statistical significances were determined using one-way ANOVA with Bonferroni’s post hoc test (a, f, g), two-tailed t-test with Welch’s correction (d) or Kruskal–Wallis test with Dunn’s multiple comparison test (c, e); *P < 0.05, **P < 0.01, ***P < 0.005, ****P < 0.0001

