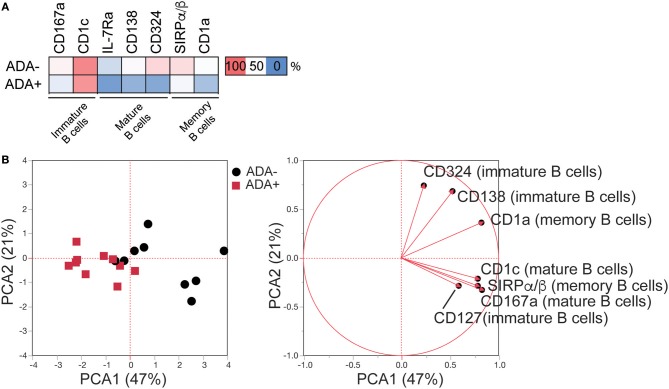
Figure 2.
LEGENDScreen™ analysis of adalimumab treated RA patients (cross-sectional cohort) identifies an immune-module associated with ADA. LEGENDScreen™ analysis as Figure 1. (A) Heatmap showing mean frequency of differentially expressed markers (DEMs) (p-value defined in Table S1), between patient groups on B cell subsets, following exclusion of markers associated with DAS28 and “treatment effect” (see Figure S2 for details). (B) PCA of frequency of expression of the DEMs on the 20 adalimumab treated RA patients (ADA− black circles, ADA+ red squares) with contribution of each marker to the principal components denoted by length and direction of the corresponding red arrow.

