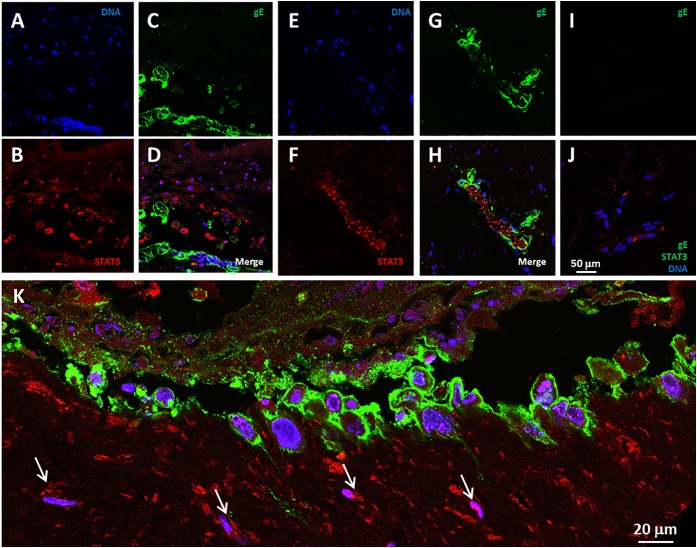
FIGURE 3.
STAT3 expression in VZV infected human skin explants. (A–H) STAT3 expression at 14 dpi (A–D) and 28 dpi (E–H). The panels show infectious foci outlined by VZV gE immunolabeling mainly in the outer cell membranes, with STAT3 positive cells in the vicinity of the infected cells. (A,E) Blue, Hoechst 33342. (B,F) Red, STAT3. (C,G) VZV gE, green. Panels D,H are the merged images of infected explants. (I,J) Control images of mock-infected skin explants. The white bar in panelJ represents all prior panels. (K) A higher magnification landscape image of an infectious focus at 14 dpi with a merge of all colors. Arrows designate cells with immunolabeling for STAT3.

