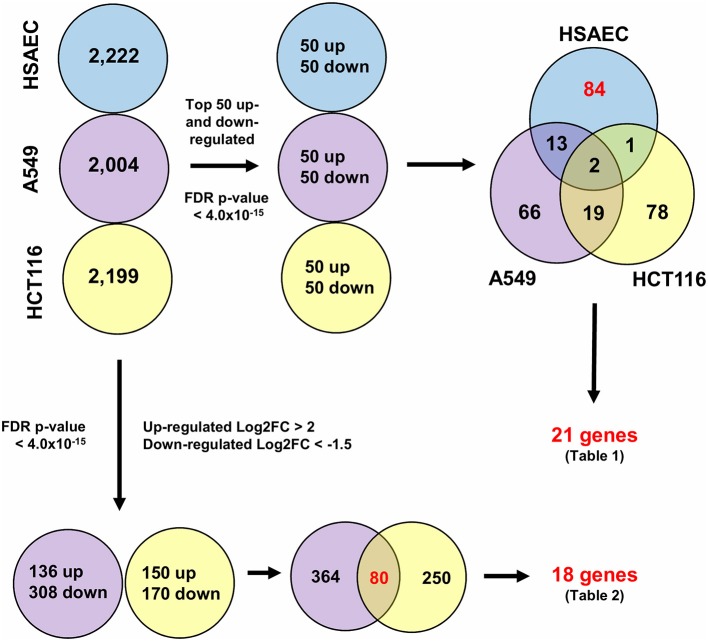
Figure 2.
Differentially expressed genes from CLC Workbench for HSAEC, A549 and HCT116 after 24 h treatment with 1.0 μM PG. Blue circles represents HSAEC, purple as A549 and yellow as HCT116. Twenty one genes for Table 1 were derived from filtering 84 HSAEC-specific genes on the condition that corresponding genes in A549 and HCT116 had an FDR p-value < 0.05, and secondly, the difference of A549 and HCT116 gene expression in terms of Log2FC with HSAEC had to be > ± 1.5. Eighteen genes for Table 2 were derived from filtering 80 genes common to A549 and HCT116 on the condition that corresponding genes in A549 with HSAEC had an FDR p-value < 0.05, and secondly, the difference of A549 and HSAEC gene expression in terms of Log2FC with HSAEC had to be > ± 1.5.

