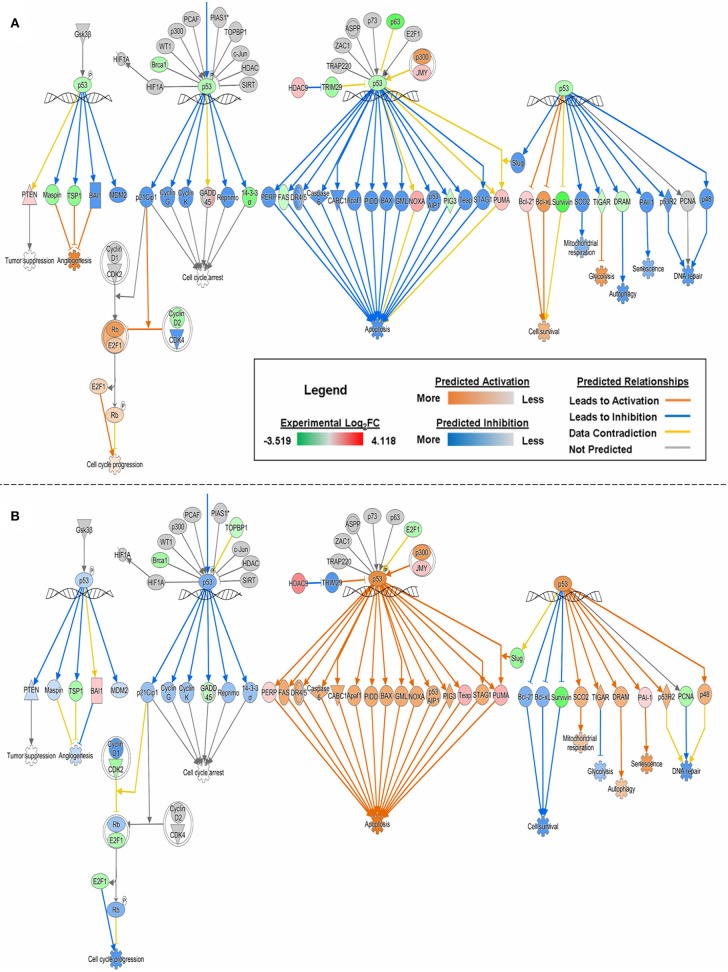
Figure 3.
MAP of “p53 Signaling” pathway in (A) HSAEC and (B) A549 cells treated with 1 μM PG over 24 h. Predictions were calculated based upon DEGs from the experimental dataset overlaid onto the Ingenuity Knowledge Base in IPA. Orange, blue, yellow, and gray lines corresponds to predicted activation, inhibition, contradiction, and the inability to predict an outcome, respectively. Red or green color intensities within shapes reflect the level of upregulation or downregulation, respectively, based upon the experimental Log2FC values. Orange or blue color intensities within shapes reflect the level of predicted activation or inhibition, respectively, based on upon IPA's predictions.

