Figure 1.
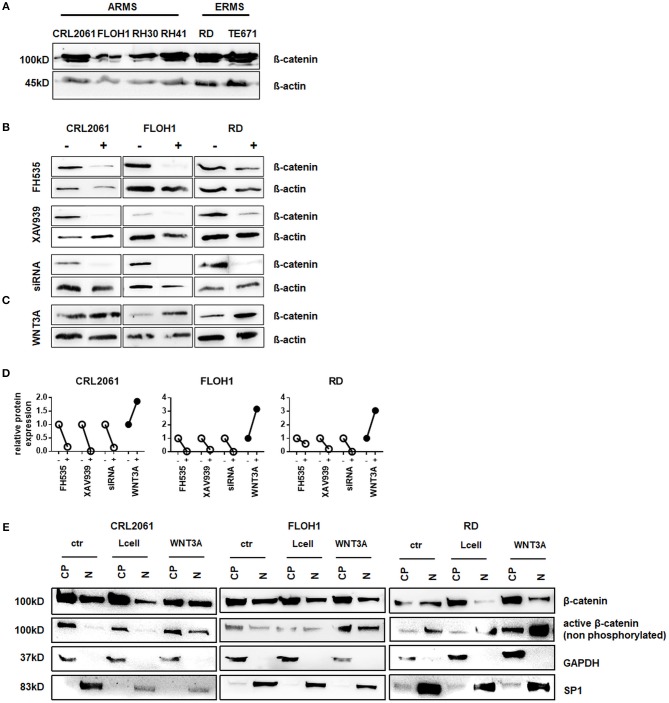
Western Blot analysis of β-catenin expression in RMS tumor cell lines. (A) Western Blot analysis of ß-catenin expression in various RMS tumor cell lines. ß-actin served as loading control. (B) Western Blot analysis of ß-catenin expression in three different RMS tumor cell lines after 48 h treatment with either FH535, XAV939, ß-catenin siRNA, or (C) WNT3A treatment. ß-actin served as loading control. (D) Densitometric quantification of the Western Blots shown in (C) using ImageJ. Expression of ß-catenin after treatment (+) was normalized to ß-actin and compared to untreated cells (−). (E) subcellular localization of ß-catenin in the RMS tumor cell lines with and without WNT3A stimulation. GAPDH served as cytoplasmatic and SP1 as nuclear marker to check purity of the protein isolation from different compartments. CP, cytoplasmatic; N, nuclear.

