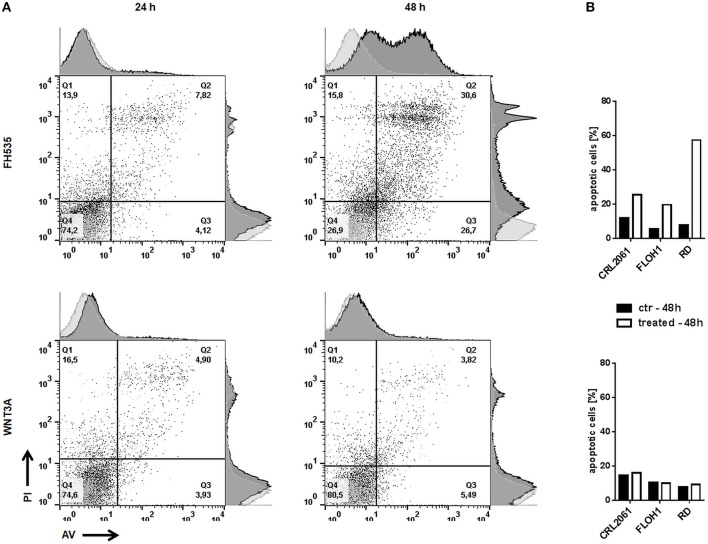
Figure 6.
Effects of FH535 and WNT3A on apoptosis of RMS cell lines. (A) Flow cytometry analysis of Annexin V/PI positive RD tumor cells 24 and 48 h after treatment with FH535 (upper panel) or WNT3A (lower panel). An additional histogram plot on the Annexin V- (x-) axis and PI- (y-) axis illustrates the shift of apoptotic cells (dark gray) compared to untreated control cells (light gray). (B) represents a graphic summary of the apoptotic cells of all three cell lines in percent after 48 h of treatment.

