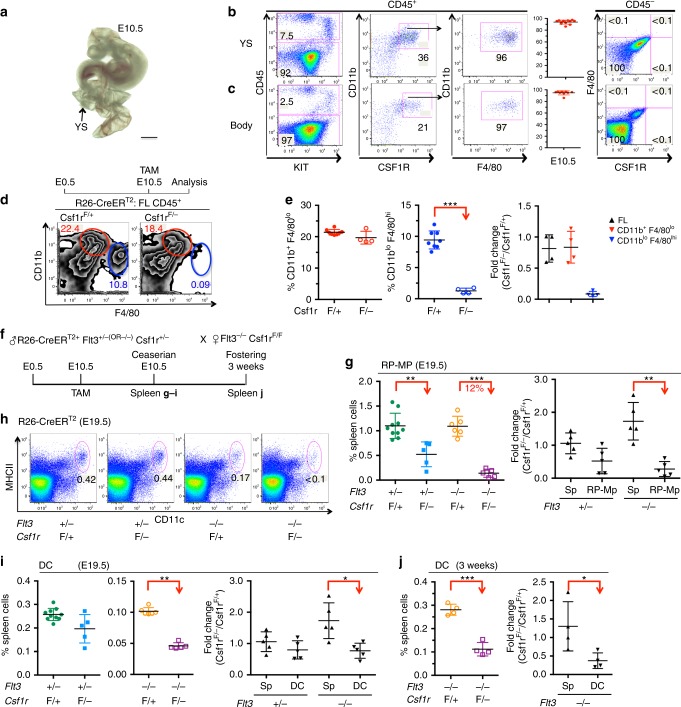
Fig. 3.
Embryo-derived spleen CD11blo F4/80hi macrophages depend on CSF1R-mediated signals for their generation. a Photograph of E10.5 embryo with yolk sac (YS). Scale bar corresponds to 1 mm. b, c Dot plots show yolk sac (b) or body cells excluding head tissues (c) analyzed for the expression of CD45 and KIT (left). CD45-expressing cells are further resolved for the expression of CD11b and CSF1R (second left). CSF1R+ cells co-express F4/80 (third left). Plots show the frequencies of F4/80-expressing cells within the CSF1R-positive population (second right). Each dot represents one mouse. CD45-negative cells are resolved for the expression of F4/80 and CSF1R (right). d Schematic outline of TAM-induced depletion of CSF1R expression in the embryo (top). Contour plots resolve CD45+ fetal liver cells from E14.5 R26-CreERT2+;Csf1rF/− and control embryos for the expression of CD11b and F4/80 (bottom). e Plots show the frequencies of CD11b+ F4/80lo (left) or CD11blo F4/80hi (middle) cells in the fetal liver of R26-CreERT2+;Csf1rF/− and control embryos. Right plot shows fold-change differences of leukocyte and macrophage populations in the fetal livers. Data are summarized from three independent experiments. Two-sided t test (left) and Mann–Whitney U test (right) were performed. SD is shown. f Schematic outline of TAM-induced depletion of CSF1R expression in R26-CreERT2+;Flt3−/−;Csf1rF/− and control embryos. TAM was administered at E10.5. g Frequencies (left) and fold-change differences (right) of leukocytes and RP-Mps in the spleens of R26-CreERT2+;Flt3−/−;Csf1rF/− and control pups at E19.5. Data are summarized from four independent experiments. Two-sided t test (left) and Mann–Whitney U test (right) were performed. SD is shown. h Dot plots show DCs in R26-CreERT2+;Flt3−/−;Csf1rF/− and control mice at E19.5. Numbers indicate frequencies of dendritic cells within Dapi− cells. i, j Plots show DC frequencies and fold-change differences of leukocytes and DCs in the spleen of E19.5 pups (i) or at 3 weeks of age (j) in R26-CreERT2+;Flt3−/−;Csf1rF/− and control mice that were TAM-induced at E10.5. Data are summarized from three independent experiments. Two-sided t tests (left) and Mann–Whitney U tests (right) were performed. SD are shown

