Fig. 3.
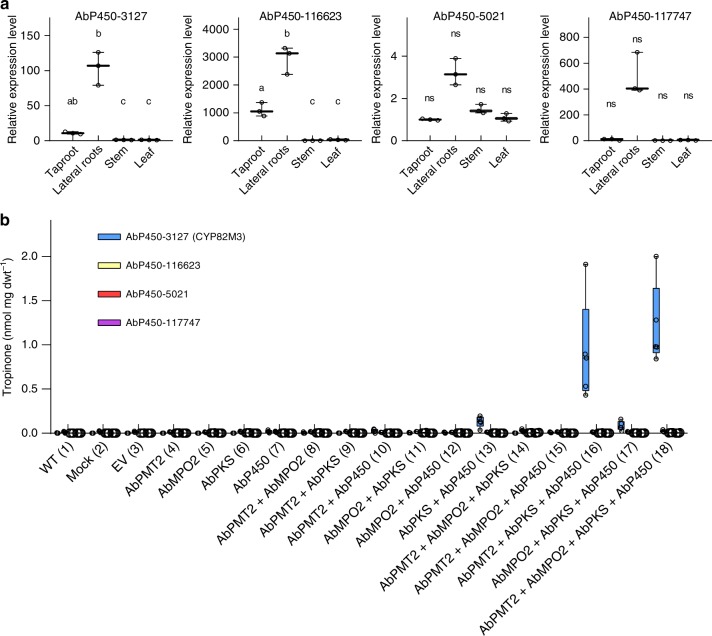
Tropinone biosynthesis requires AbCYP82M3. a Relative expression level of root preferentially expressed cytochrome P450s in A. belladonna as determined by qRT-PCR. Data are presented as three biological and three technical replicates relative to the expression level of each P450 in the tissue where its expression is lowest. Different letters indicate significant differences (p ≤ 0.05) in expression level between tissue types, as determined by a Brown–Forsythe and Welch one-way ANOVA (see Methods). ns, not significant. For each box plot, the line represents the median value and the whiskers extend to the minimum and maximum data points. b Tropinone (7) accumulation in N. benthamiana leaves infiltrated with combinations of Agrobacterium tumefaciens strains individually transformed with the indicated constructs. Wild-type (WT) uninfiltrated leaves, leaves infiltrated with infiltration solution without A. tumefaciens (Mock), and leaves infiltrated with the empty pEAQ vector (EV) were included as negative controls. Data are presented as n = 5 biological replicates except for infiltration 2 where n = 3, and infiltrations 7 and 10 where n = 4 in genotype CYP82M3, and infiltration 1 and 3, where n = 4 in genotype AbP450-5021. For each box plot, the lower and upper bounds of the box indicate the first and third quartiles, the line indicates the median value, and the whiskers extend to the minimum and maximum data points. Data presented are aggregated from individual data points presented in Supplementary Figures 9f–12f. Tropinone (7) was only formed in plants expressing AbCYP82M3 (blue bars). Source data are provided as a Source Data file

