Fig. 1.
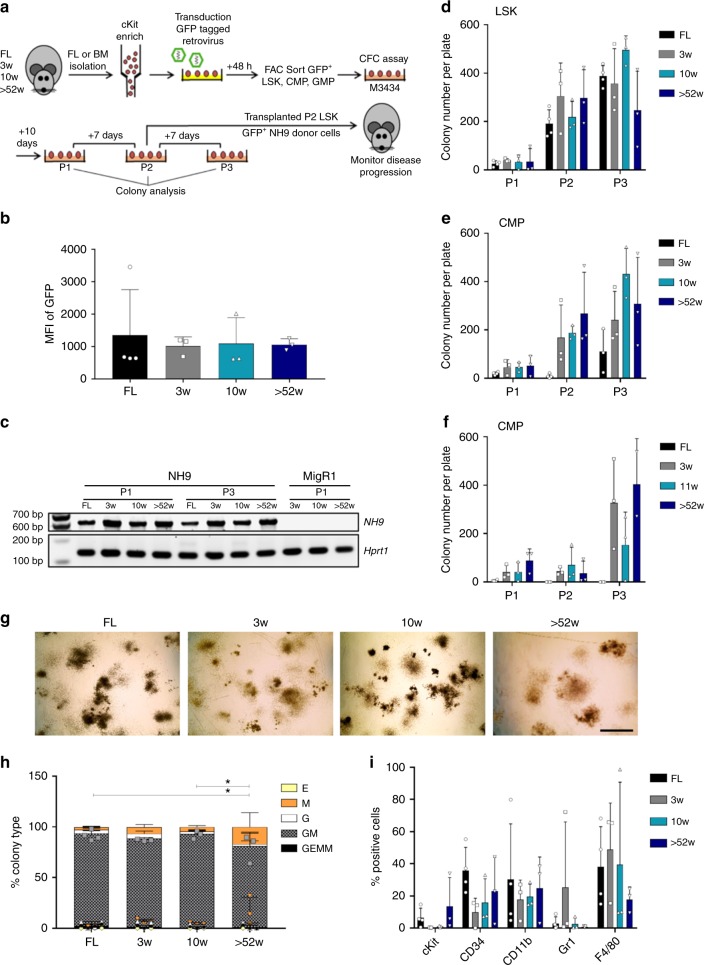
LSKs from all ages display comparable in vitro transformation ability. a Schematic of CFC assay and transplantation model. Murine FL or BM cells were isolated from mice of ages indicated. cKit enriched cells were transduced with GFP tagged NH9 virus. After 48 h the cells were sorted for GFP+ LSKs, CMPs and GMPs and plated in methylcellulose media (M3434). Cells were replated to P3 and colonies were counted and analysed at each plating. Cells from P2 colonies were transplanted into sub-lethally irradiated recipient mice. b Graph of cells from P3 showing no difference in the MFI of GFP with cellular age. c Gene expression by RT-PCR of NH9 and Hprt1 (endogenous control) in NH9 (FL, 3w, 10w, >52w) or MigR1 (3w, 10w, >52w) transduced LSKs from P1 or P3 where indicated. Graphs of the number of colonies per plate from serial replating CFC assay, produced by NH9 transduced d LSKs, e CMPs and f GMPs. g Representative morphology of colonies at ×2 magnification from each age group at P3. Black scale bar represents 2 mm. h Graph of percentage colony type produced at P3 by NH9 transduced LSKs. GEMM Granulocyte erythroid macrophage megakaryocyte, GM Granulocyte macrophage, G granulocyte, M macrophage and E erythroid. i Graph of surface marker expression at P3 showing no significant differences with cellular age. b, d–f, h, i) Bars depict mean + s.d. Significance determined by one-way ANOVA and Bonferroni post-test. FL n = 4, 3w n = 3, 10w n = 3, > 52w n = 3, *p < 0.05

