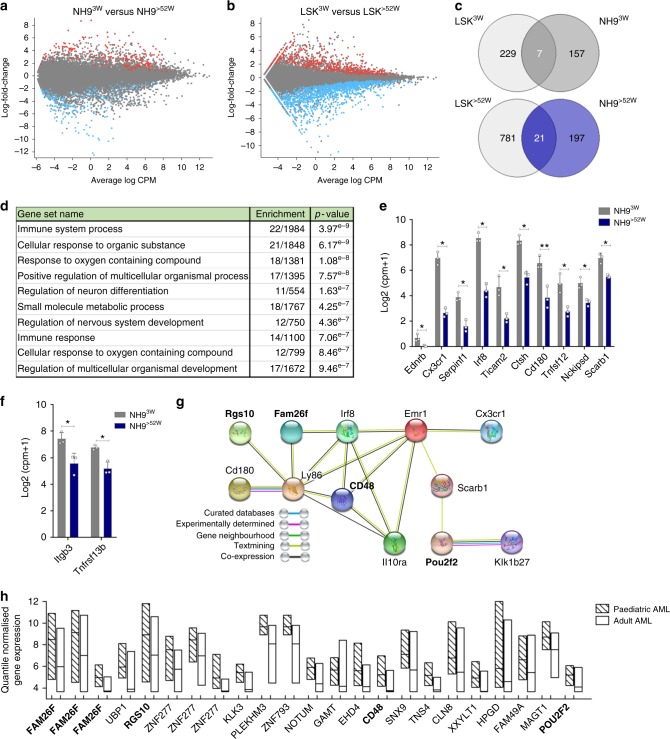
Fig. 5.
Differential enrichment of pathways in age-defined AML. MA plot highlighting significantly DEGs from pairwise comparisons between a myeloid leukaemia cells from NH93W and NH9>52W and b healthy LSKs of 3w (LSK3W) and >52w (LSK>52W) origin. 1 RNA sequencing experiment with n = 3 biological replicates per group. DEGs with adjusted p-value <0.05 and LFC ≥1.5 highlighted in red (up in NH9>3W) and in blue (up in NH9>52W). c Venn diagram showing overlapping genes from LSK3W and NH93W DEGs (top) and LSK>52W and NH9>52W DEGs (bottom). d Top ten enriched GO pathways using DEGs upregulated in NH93W compared to NH9>52W samples but not in LSK3W (157 DEGs). Analysis performed on MSigDB using C5 module (GO Biological Processes) with an FDR q-value of <0.05. e DEGs upregulated in NH93W compared to NH9>52W but not in LSK3W, in common to 5 or more of the top 10 pathways identified in d. f Graph of genes from cluster (ii) (See Supplementary Figure 3c, d) that are significantly upregulated in NH93W compared to NH9>52W. g Protein interaction network of selected proteins whose gene expression was significantly upregulated in NH93W compared to NH9>52W but not in LSK3W, predicted by STRING. Different types of associations between the selected proteins are represented by different line colours as indicated in legend. Genes highlighted in bold were also identified as significantly enriched in the human paediatric dataset in h. h Quantile normalized gene expression of NH93W DEGs that were significantly enriched in human paediatric AML samples (n = 237) compared to human adult AML samples (n = 537). Floating bars represent min and max values with mean. Individual probes shown, some genes with multiple probes present. Genes highlighted in bold were also identified in STRING protein hub g

