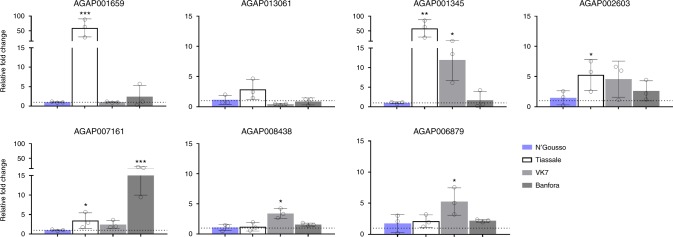
Fig. 2.
qPCR analysis of top insecticide resistance candidates from multiple resistant populations. qPCR results of three 3–5 day old, unexposed, pyrethroid resistant Anopheles populations compared to the lab susceptible N’Gousso, three biological replicates and three technical replicates were used for each gene. Relative fold change (y), and resistant populations (x). Standard deviation bars are shown, with significance *p ≤ 0.05, **p ≤ 0.01, ***p ≤ 0.001 as calculated by ANOVA with Dunnett’s post hoc test

