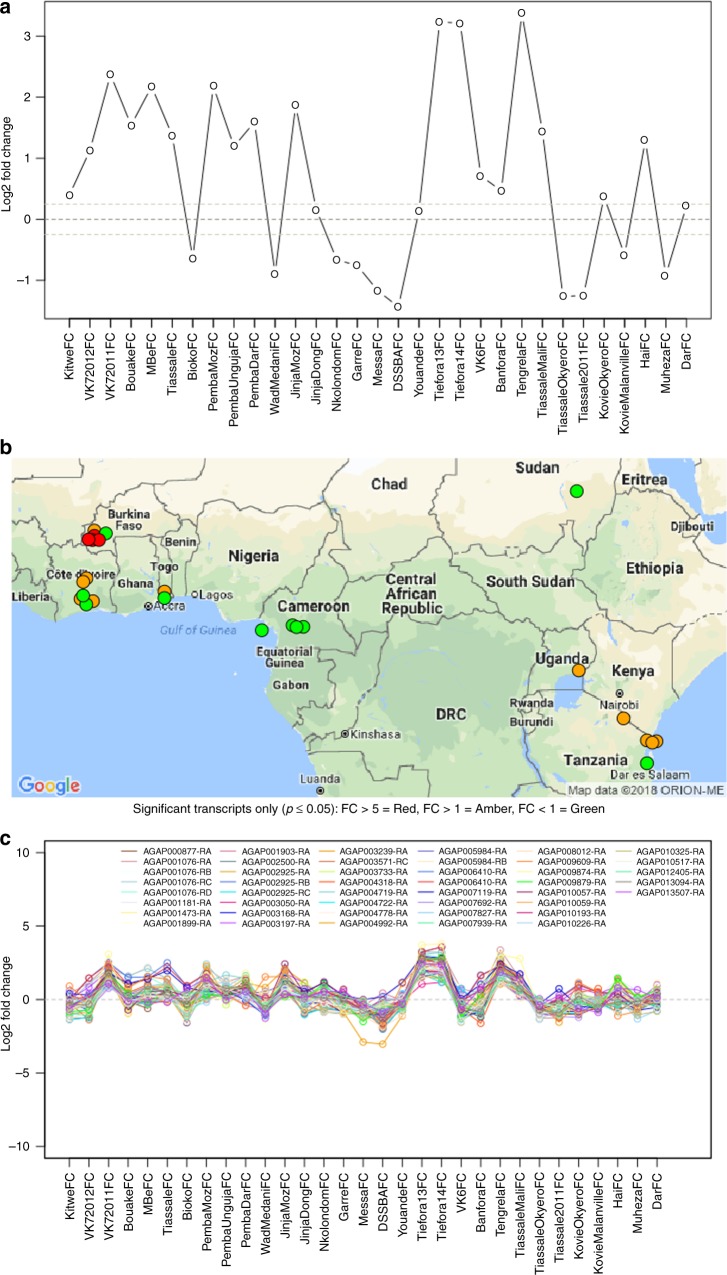
Fig. 5.
Graphical Outputs from IR-TEx App. These panels represent three graphical outputs from the IR-TEx App, each of which is available in downloadable tabular formats. These outputs result from a user inputted VectorBase ID, selected filtering criteria based on meta-data and finally, user inputted correlation value. Each panel here is AGAP001076-RA (CYP4G16). a Log2 fold change of CYP4G16 (y) across each microarray experiment meeting pre-selected user criteria (x), here all data is selected. b Each point represents a dataset with significant differential expression of CYP4G16 and the associated approximate collection site. Green points show significant down regulation of CYP4G16, orange points show significant fold changes of 1-5 and red a fold change of >5 compared to susceptible controls. Map data source: Google Maps, 2018. c Log2 fold change (y) across each microarray experiment meeting pre-selected user criteria (x) for each transcript showing a correlation of |r| ≥ 0.85 for CYP4G16

