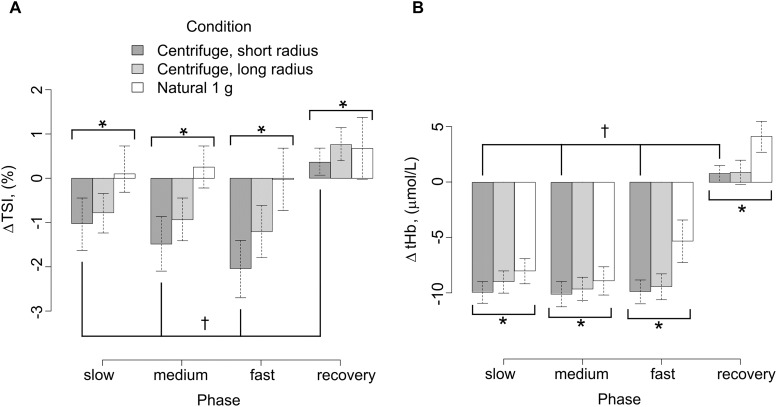
FIGURE 8.
(A) Near infrared spectroscopy results Δ TSI of the right vastus lateralis between the baseline 1 min before exercise compared to during exercise, showing mean ± SE. ∗p < 0.05 for g-condition. †p < 0.05 for cadence. (B) Near infrared spectroscopy results Δ tHb of the right vastus lateralis between the baseline 1 min before exercise compared to during exercise, showing mean ± SE. ∗p < 0.05 for g-condition. †p < 0.05 for cadence.

