Figure 4.
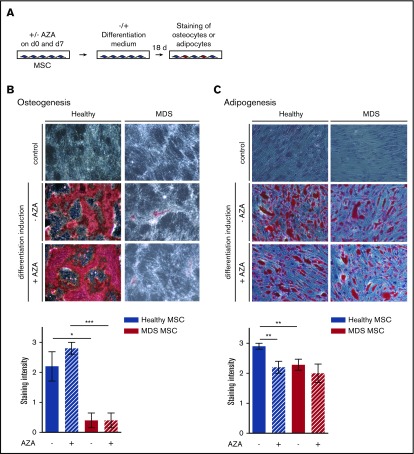
Osteogenic and adipogenic differentiation of MSCs is modulated by AZA in healthy MSCs. (A) Experimental design. Healthy and MDS MSCs were treated with 10 µM AZA on days 0 and 7. Untreated MSCs were used as controls. MSCs were differentiated for 18 days and oil-red-o staining plus Harris-hematoxylin or alizarin-red staining were used to quantify adipogenesis (C) or osteogenesis (B), respectively. Differentiation was ranked according to absent (=0), weak (=1), moderate (=2), or intense (=3) staining. (B-C) Representative images (top panel) and statistical summary (bottom panel) for (B) mean osteogenic potential of n = 5 healthy and n = 5 MDS MSCs ± SEM and (C) mean adipogenic potential of n = 10 healthy and n = 7 MDS MSCs ± SEM. *P < .05; **P < .01; ***P < .001.

