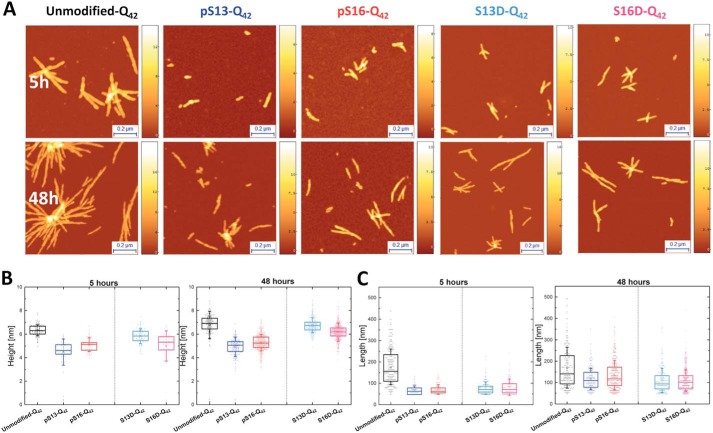
Figure 5.
Phosphorylation at Ser-13 or Ser-16 results in the formation of fibrils with significantly reduced heights compared with the unmodified Httex1-Q42 and the corresponding phosphomimetic mutants. A, AFM images of aggregates formed by mutant 42Q Httex1 Q18A phosphorylated at Ser-13 or Ser-16 and the corresponding phosphomimetic mutants. B and C, quantitative analysis of the height (B) and length (C) of these aggregates measured from AFM images (z scale bars are in nm). All scatter plots of height differ with a statistical significance of at least p < 0.05. All scatter plots of the length of the modified aggregates differ from the unmodified with a statistical significance of at least p < 0.05. Error bars, S.D.

