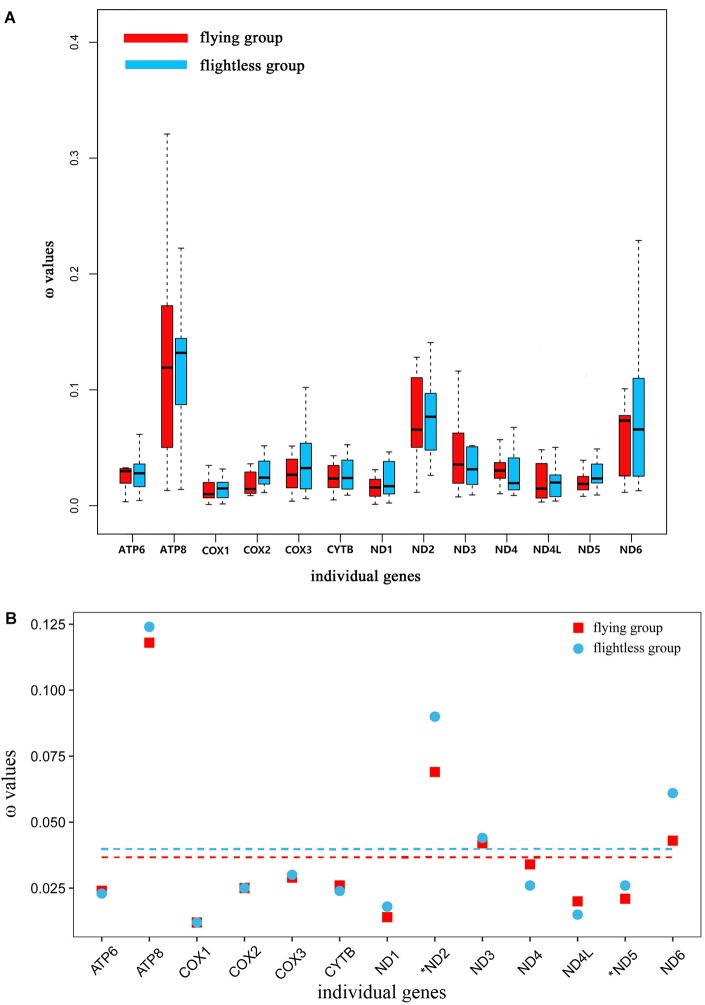
FIGURE 3.
(A) Ratio of non-synonymous to synonymous substitutions (ω) in the 13 protein-coding mitochondrial genes of flying and flightless grasshoppers based on free-ratio model. Boxes include 50% of values; ω is not significantly different between the flying and flightless grasshoppers for any gene. ATP6, P = 0.93; ATP8, P = 0.83; COX1, P = 0.63; COX2, P = 0.36; COX3, P = 0.87; CYTB, P = 0.50; ND1, P = 0.87; ND2, P = 0.50; ND3, P = 0.11; ND4, P = 0.24; ND4L, P = 0.76; ND5, P = 0.12; ND6, P = 0.72. (B) Ratio of non-synonymous to synonymous substitutions (ω) in the 13 protein-coding mitochondrial genes of flying and flightless grasshoppers based on 3 vs. 2 ratio model. Genes with a significant difference in rates are marked with an asterisk; in all two cases, the dN/dS ratio is higher in the flightless lineages than in their flight-capable counterparts. Dashed lines signify the mean ω values; flying: 0.036 and flightless: 0.040.

