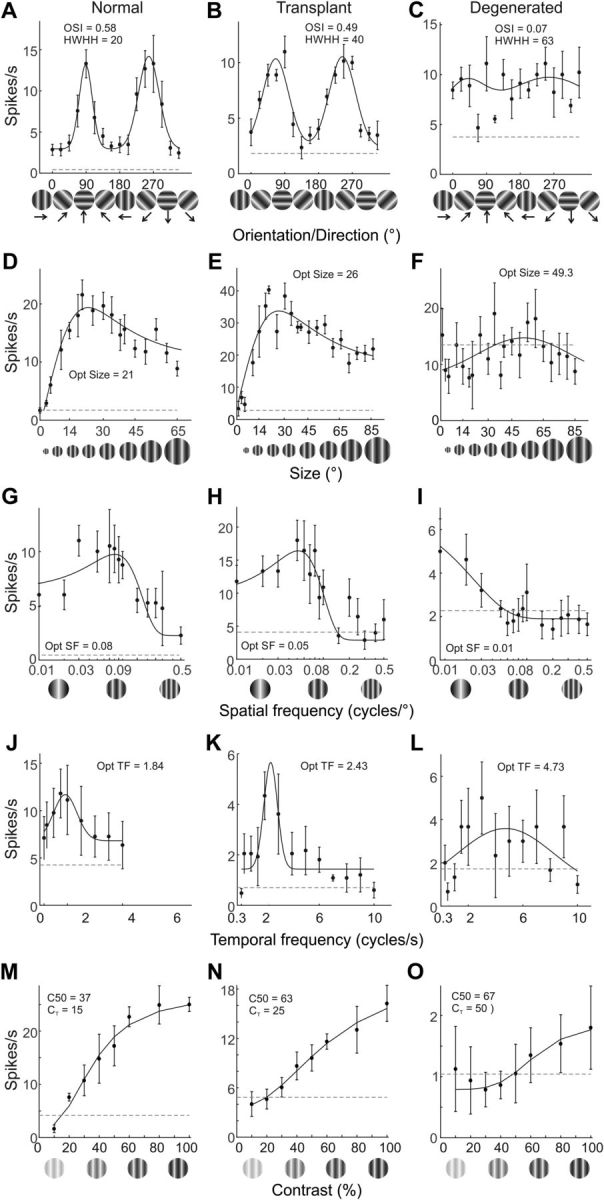
Figure 5.

Example V1 neuron tuning curves in response to an array of visual stimuli. Left column, Cells from normal rats. Middle column, Transplanted rat cells. Right column, Cells from degenerated rats. Response profiles to drifting sign wave gratings presented at different orientations (A–C). OSI and HWHH values are included to facilitate comparisons. Response profiles are also shown for stimulus size (D–F), spatial frequency (G–I), temporal frequency (J–L), and contrast (M–O). Horizontal dashed lines indicate average spontaneous activity.
