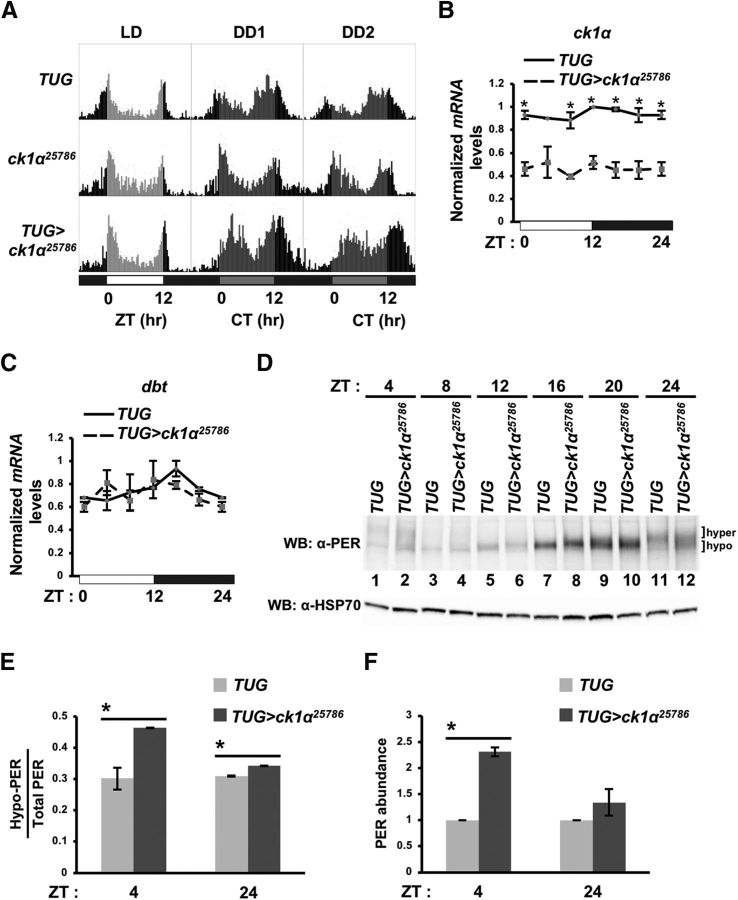
Figure 1.
Locomotor activity rhythms and temporal profile of PER phosphorylation are altered in ck1α RNAi flies. A, Flies were entrained for 4 d in LD followed by 7 d in DD (complete darkness). Shown are eduction graphs for LD3, DD1, and DD2 for TUG>ck1α RNAi25786 and parental controls. B, C, Steady-state mRNA levels of ck1α (B) or dbt (C) of TUG control (solid) and TUG>ck1α RNAi25786 (dashed) flies. mRNA level at each time point is normalized to be relative to the maximum value over the time course, which is set to 1. White and black horizontal bars below the x-axis represent periods of lights on and off, respectively. Error bars indicate SEM from two biological replicates. ZT24 data point was plotted twice as ZT0 and 24 to facilitate viewing of daily cycling. *p < 0.05. D, Flies were collected at the indicated times (ZT) on the third day of LD entrainment. Head extracts were analyzed by immunoblotting in the presence of α-PER (GP5620) (top). Equal loading was verified using α-HSP70 (bottom). Hyper and hypo, Hyperphosphorylated and hypophosphorylated PER isoforms, respectively. E, Quantification of hypophosphorylated PER shown in D using ImageLab (Bio-Rad). Following quantification, the amounts of hypophosphorylated PER at ZT4 and ZT24 were presented as a fraction of total PER isoforms. Error bars indicate SEM from two biological replicates. *p < 0.05. F, Total PER abundance at ZT4 and 24 were quantified using ImageLab (Bio-Rad). Error bars indicate SEM from two biological replicates. p < 0.05.

