Figure 3.

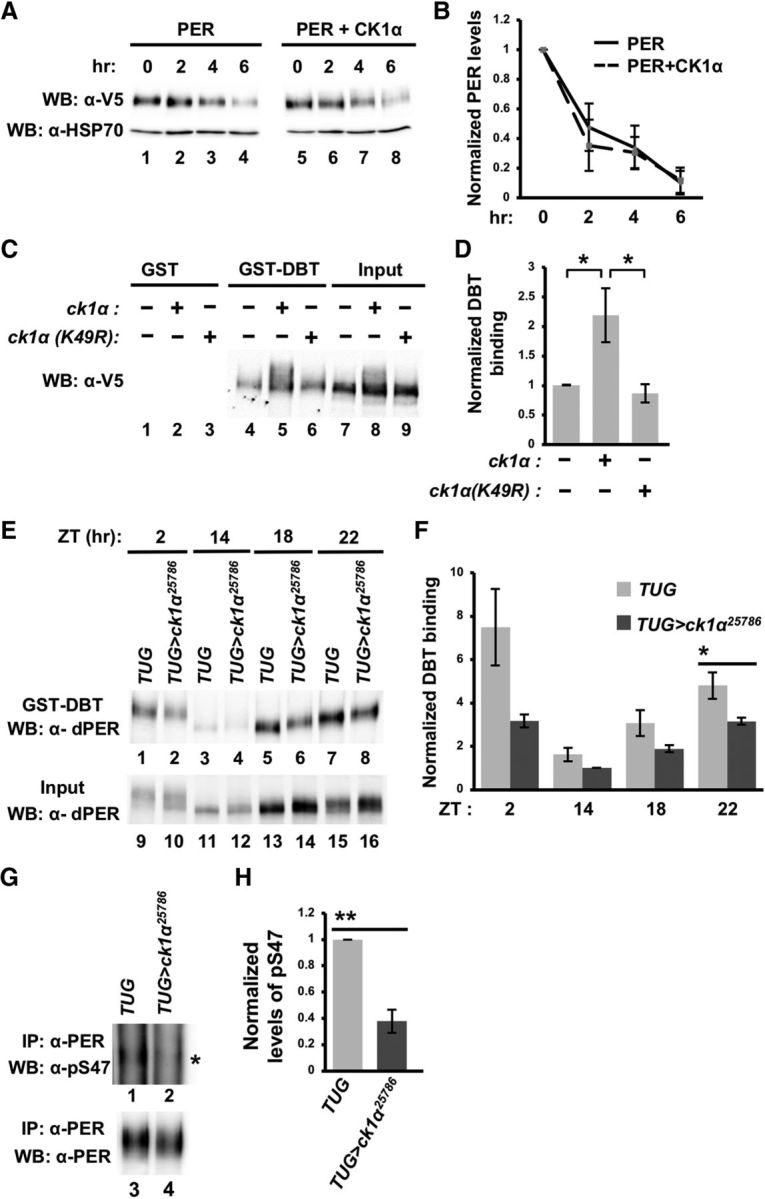
CK1α promotes PER-DBT interactions to regulate PER stability. A, Drosophila S2 cells were cotransfected with pAc-per-V5-6XHis together with either an empty plasmid (pMT-FH; FH denotes 3XFLAG-6XHis) or pMT-ck1α-FH. Following a 24 h incubation period, kinase expression was induced with CuSO4 for 16 h. Following induction, CHX was added and cells were harvested for protein extractions at the indicated times (in hours). Proteins were visualized by Western blotting and detected with α-V5. B, Western blots were quantified using ImageLab (Bio-Rad) and normalized against α-HSP70. Error bars indicate SEM from two biological replicates. C, S2 cells were transfected with pAc-per(NLS)-V5-His together with an empty plasmid (pMT-FH), pMT-ck1α(WT)-FH, or pMT-ck1α(K49R)-FH. Equal amounts of the extracted proteins were then incubated with glutathione resin bound with GST or GST-DBT. Bound PER (lanes 4–6) was eluted with 2× SDS loading buffer and visualized via Western blotting in the presence of α-V5. D, Western blots from C were quantified using ImageLab (Bio-Rad) and normalized against input (lanes 7–9). Values were normalized against the PER-NLS sample (without expression of the kinase), which was set as 1. Error bars indicate SEM from four biological replicates. *p < 0.05. E, Head extracts from TUG control or TUG>ck1α RNAi25786 flies were prepared and aliquots containing equal amount of total protein for each sample were incubated with glutathione beads bound with GST-DBT. The amount of PER in total head extracts (input) and those that are bound to GST-DBT were visualized by immunoblotting in the presence of α-PER (GP5620). F, Quantification of GST-DBT pull-down assays presented in E. Error bars indicate SEM from four biological replicates. *p < 0.05. G, Head extracts from TUG control or TUG>ck1α RNAi flies were immunoprecipitated with α-PER (GP5620) before Western blotting analysis in the presence of α-PER(pS47) (top) and α-PER (GP5620) (bottom). Asterisk indicates the majority of PER(pS47)-containing isoforms (top). H, Western blots from G were quantified using ImageLab (Bio-Rad) and normalized against the amount of immunoprecipitated total PER. Levels of PER(pS47)-containing isoforms in TUG control were set at 1. Error bars indicate SEM from three biological replicates. **p < 0.005.
